







Net profit is up 4%, yet earnings per share went down. Sounds like a riddle, but it happens more often in real financial statements than you might think. People who glance only at the bottom line feel relieved; people who read from the top start to frown.
That is exactly why how to read an income statement is worth learning, even for those of us who don’t deal with accounting every day. An income statement is a report that summarizes a company’s revenue and expenses over a period, such as one year, so we can see whether the company made a profit or a loss. Indonesia’s Financial Services Authority, OJK, defines it in much the same way. Unlike the balance sheet, which captures a position on a single date, the income statement records performance across a span of time.
Think of an income statement as a payslip. The gross salary on the top line always looks encouraging, but what we actually take home only shows up after one deduction after another (which is usually when our smile starts to fade). The income statement follows the same logic: sales at the top, then costs subtracted layer by layer until net profit is all that’s left.
So we don’t stop at theory, we will practice how to read an income statement with one example from start to finish: the statement of an imaginary company, danieel.id Company, for 2018–2019. The figures are not real company data and are not meant as investment advice.
An Example Income Statement from the Imaginary danieel.id Company
The danieel.id Company income statement shows its 2019 figures side by side with 2018, so every change can be compared at a glance. Presenting comparative figures like this is required by international standards, and from 1 January 2027 IFRS 18 on presentation and disclosure in financial statements takes effect for annual reporting periods, with earlier application permitted.
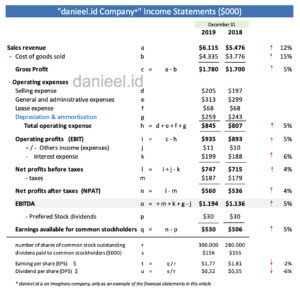
The formulas in the middle column are shown on purpose so the flow is easy to follow: sales minus cost of goods sold gives gross profit, minus operating expenses gives operating profit, and so on down to net profit. The key figures are summarized in the table below.
| Item ($000) | 2018 → 2019 | Change |
|---|---|---|
| Sales revenue | 5,476 → 6,115 | +12% |
| Cost of goods sold | (3,776) → (4,335) | +15% |
| Gross profit | 1,700 → 1,780 | +5% |
| Total operating expense | (807) → (845) | +5% |
| Operating profit (EBIT) | 893 → 935 | +5% |
| Net profit after tax | 536 → 560 | +4% |
| EBITDA | 1,136 → 1,194 | +5% |
| EPS ($ per share) | 1.81 → 1.77 | -2% |
| DPS ($ per share) | 0.55 → 0.52 | -6% |
Percentages are rounded. The figures in the table and image are for education, not a public company’s report.
At first glance almost every line goes up, but the bottom two lines move in the opposite direction.
How to Read an Income Statement from Top to Bottom
The safest way to read an income statement is to follow each layer from top to bottom instead of jumping straight to net profit. At every layer, ask one simple question: why did this number change compared with the previous period?
Revenue or Sales Revenue
Revenue is the value of goods or services sold and recognized during the reporting period. In this example, danieel.id Company’s revenue rose from $5.476 million to $6.115 million, an increase of about 12%.
When learning how to read an income statement, that number is only the beginning. We still need to find out whether the growth came from sales volume, higher prices, new products, or a mix of all three. Revenue growth driven only by price means something different from healthy volume growth.
Cost of Goods Sold and Gross Profit
Cost of goods sold (COGS) is the cost directly tied to production, such as raw materials, direct labor, and factory overhead. Revenue minus cost of goods sold gives gross profit.
This is the layer where knowing how to read an income statement starts to pay off. Revenue rose 12%, but cost of goods sold rose faster, at 15%, so gross profit grew only 5%. It’s like the martabak (stuffed pancake) seller near our house when egg and butter prices go up: business is booming, but the profit per pancake gets thinner because the selling price can’t be raised right away.
Keep in mind that the income statement alone can’t confirm the cause. It could be raw material prices, direct wages, product mix, or difficulty raising prices; the answer usually lies in the notes to the financial statements and management’s commentary.
Operating Expenses and Operating Profit
Operating expenses are the costs of running the business outside production, such as selling expenses, general and administrative expenses, lease expense, and depreciation and amortization. Gross profit minus operating expenses gives operating profit, or EBIT.
The good news is that danieel.id Company’s total operating expenses rose only about 5%, from $807 thousand to $845 thousand, well below revenue growth. As a share of sales, they even fell from about 14.7% to 13.8%. Unfortunately, EBIT still grew only 5% because the main pressure had already hit one layer above, at cost of goods sold.
Profit Before Tax and Net Profit
Profit before tax is EBIT adjusted for other income and reduced by interest expense. In this example, that works out to $935 + $11 − $199 = $747 thousand. After $187 thousand in taxes, net profit comes to $560 thousand, up about 4% from $536 thousand.
Interest, depreciation, and amortization can reduce taxable income, but not automatically in every situation; their treatment follows the applicable tax rules.
Read the Margins, Not Just Nominal Growth
A margin compares each level of profit with revenue, and it is the most important habit in learning how to read an income statement. Margins reveal the quality of growth, not just the size of the numbers.
- Gross profit margin = gross profit ÷ revenue. Down from about 31.0% in 2018 to 29.1% in 2019.
- Operating margin = EBIT ÷ revenue. Down from about 16.3% to 15.3%.
- EBITDA margin = EBITDA ÷ revenue. Down from about 20.7% to 19.5%.
- Net profit margin = net profit ÷ revenue. Down from about 9.8% to 9.2%.
Every profit figure did rise in nominal terms, yet every key margin fell. As a rough picture, out of every $100 in sales, the gross profit left over shrank from about $31 to $29. That sounds small, but if the 2019 gross margin had held at 31.0%, danieel.id Company’s gross profit would have been about $118 thousand higher. That’s more than a fifth of its net profit that year.
In other words, reading an income statement by looking only at growth percentages can be misleading, because profit that “went up” doesn’t necessarily mean the company became more efficient. Margins and other ratios are covered in more detail in the article on company financial ratios.
Understanding EBITDA, EPS, and DPS
EBITDA, EPS, and DPS are three derived figures analysts quote often because each answers a different question: how strong the core operations are, how much profit each share earns, and how much dividend each share receives.
EBITDA
EBITDA is earnings before interest, taxes, depreciation, and amortization. In this example, the easiest way to calculate it is EBIT plus depreciation and amortization: $935 thousand + $259 thousand = $1.194 million in 2019, up from $1.136 million in 2018. The result matches the formula in the image.
EBITDA is useful for viewing operating performance before the effects of financing and non-cash costs, but it is no substitute for net profit or cash flow (an aging factory machine still has to be replaced, even if its depreciation is “erased” from EBITDA). The difference is discussed in more depth in the article EBITDA vs Net Profit.
EPS and DPS
EPS (earnings per share) is the profit available to common shareholders divided by the number of common shares outstanding. After deducting $30 thousand in preferred stock dividends, danieel.id Company has $530 thousand for common shareholders. Divided by 300,000 shares, 2019 EPS comes to $1.77.
This is where the riddle at the start of the article gets solved, and it’s also a key lesson in how to read an income statement: don’t stop at net profit. Net profit rose, but EPS fell from $1.81 to $1.77. The reason is that common shares outstanding grew from 280,000 to 300,000, or about 7.1%, faster than earnings for common shareholders, which grew only about 5%. The cake got bigger, but so did the number of people cutting slices. This is called dilution.
DPS (dividend per share) met a similar fate, falling from $0.55 to $0.52. Total dividends edged up from $155 thousand to $156 thousand, but they were split across more shares.
Reviewing the danieel.id Company Income Statement
Once we follow how to read an income statement all the way to the last line, we can see that danieel.id Company is still growing and still profitable, but the quality of its growth is weakening. Revenue, gross profit, EBIT, net profit, and EBITDA all rose, and operating cost control looks fairly good.
The problem is that cost of goods sold grew faster than revenue, so gross margin shrank by almost 1.9 percentage points, and that pressure flowed all the way down to net profit margin. The additional shares also pushed EPS and DPS down.
The fair conclusion is not “the company must be bad” or “avoid the stock.” Investors aren’t fortune tellers, hehe. This example instead raises follow-up questions, summarized in the next section.
Key Questions After Reading the Numbers
A good reading of an income statement should end with a list of questions, not just an “up” or “down” verdict. Here are questions worth asking after studying the danieel.id Company example:
- Did the revenue increase come from volume, selling price, new products, or acquisitions?
- Why did cost of goods sold grow faster than revenue?
- Was the margin decline a one-off, or has it become a multi-year trend?
- Are operating expenses growing more slowly than the scale of the business?
- Is net profit backed by operating cash flow, or still tied up in receivables?
- Did EPS change because of profit, new share issuance, share buybacks, or a combination of these?
To answer them, the income statement needs to be read together with the balance sheet, the cash flow statement, the statement of changes in equity, and the notes to the financial statements.
Two Main Paths to Higher Profit
Once we understand how to read an income statement, it becomes clear that a company basically has two paths to higher profit: increasing revenue or controlling costs. This framework is also used in the classic textbook Principles of Managerial Finance by Lawrence J. Gitman and Chad J. Zutter.
Revenue is sales volume multiplied by selling price. So growth can come from selling more, raising prices, improving the product mix, or launching new products.
On the cost side, efficiency doesn’t always mean cutting carelessly. A company needs to sort out which costs can be reduced without hurting quality, capacity, safety, and long-term growth. The bigger picture is covered in the article Types of Financial Statements.
Frequently Asked Questions about the Income Statement
How to read an income statement as a beginner?
Start with revenue on the top line, then follow each deduction down to net profit while comparing every figure with the previous period. After that, turn each level of profit into a margin.
Why can net profit rise while EPS falls?
EPS can fall even when net profit rises if the number of shares outstanding grows faster than earnings available to common shareholders. In the danieel.id Company example, shares increased by about 7.1%, while earnings for common shareholders rose only about 5%.
So, Did Profit Really Go Up?
In short, the most useful way to read an income statement is to follow its flow from revenue to net profit, compare every figure with the previous period, and then test the margins. The danieel.id Company example shows that nominal profit can rise while margins, EPS, and DPS actually fall.
Just like a payslip, the top line doesn’t tell you what’s left; that’s why learning how to read an income statement means starting at the top and finishing at the bottom. The income statement gives the beginning of the story, not the whole story; the balance sheet, cash flow statement, changes in equity, notes to the financial statements, and business context fill in the rest.
The first step to practice how to read an income statement is simple: pick the annual report of a company whose products you know, calculate its gross margin and net margin for the last two years, and see whether the story matches the news headlines about that company.
If you were the manager of danieel.id Company, which path would you take first to restore margins: raising selling prices or cutting cost of goods sold? I’m curious to read your answer in the comments.
The numbers in a financial statement only truly tell their story to those willing to read all the way to the last line.
This post is also available in: