







Where the cash comes in, where it goes out, and why a company’s profit isn’t always the money sitting in its bank account.
Picture the owner of a building supply store on the edge of town. At year-end, the books show a profit of hundreds of millions of rupiah. Three weeks later, staff salaries and a cement supplier’s invoice fall due on the same day, and the bank balance can’t cover both. Profitable on paper, but where did the money go?
The answer is almost always hiding in the cash flow statement. A cash flow statement is a financial report that shows where a company’s cash came from and where it went during a period, grouped into operating, investing, and financing activities. Even the simplest way to read one starts with those two questions: where did the money come from, and where did it go?
Those questions matter because accounting runs on an accrual basis. Sales are recognized when goods are delivered, even if the customer hasn’t paid yet, and expenses are recorded when the obligation arises, even if payment comes later. As a result, a company can book a profit while running out of breath on the cash side. That is why PSAK 207 on Statements of Cash Flows, Indonesia’s accounting standard (formerly PSAK 2), requires changes in cash and cash equivalents to be grouped into those three activities, in line with the international standard IAS 7 Statement of Cash Flows.
Imagine the cash flow statement as the transaction history you print out at the bank. Your payslip, which works a lot like an income statement, may show a healthy salary, but it’s the transaction history that honestly reveals when money actually came in and went out (and it’s usually the transaction history that makes us repent of our trendy iced coffee habit the fastest). Its entries fall roughly into three groups: salary and monthly shopping (operating), buying a motorbike or a laptop for work (investing), and loans and installments (financing).
For practice, we’ll use one example that runs from start to finish: the cash flow statement of an imaginary manufacturer, danieel.id Company, for the year ended December 31, 2019. The example is based on Principles of Managerial Finance, 13th edition, by Lawrence J. Gitman and Chad J. Zutter. All figures are in thousands of US dollars ($000) and are for learning purposes only, not investment advice.
There are six connected steps. Let’s start with the relationship that confuses people most: profit versus cash.
How to Read a Cash Flow Statement and Its Link to Profit
A cash flow statement prepared with the indirect method always starts from net income, then adjusts it for non-cash items and changes in working capital until it arrives at the cash actually generated by operations. That is why net income can’t simply be treated as cash landing in the company’s bank account.
Accounting standards actually allow two ways of presenting it. The direct method lists cash received from customers and cash paid to suppliers and employees line by line, while the indirect method starts from profit. According to ACCA’s article on IAS 7, the direct method is encouraged, yet most entities use the indirect method. The danieel.id Company example uses the indirect method too.
The easiest example is a credit sale. Our building supply store might ship cement and steel to a housing project on 60-day payment terms. The sale is already recorded and the profit already recognized, but the money is still “parked” in accounts receivable. So an increase in receivables means part of the profit hasn’t turned into cash yet.
Depreciation and amortization work the other way. Both reduce profit on the income statement, yet not a single rupiah leaves the cash box during the period, so they are added back. The same logic applies when calculating EBITDA, as explained in EBITDA vs net profit. You can trace where this example’s profit comes from in how to read a company’s income statement, while the changes in receivables, inventory, payables, and fixed assets appear in how to read a company balance sheet.
Summary of the danieel.id Company Cash Flow Statement
The 2019 cash flow statement of danieel.id Company shows $801 of cash from operations, $1,251 of cash spent on investing, and $696 of cash from financing, so cash and marketable securities rose by a net $246.
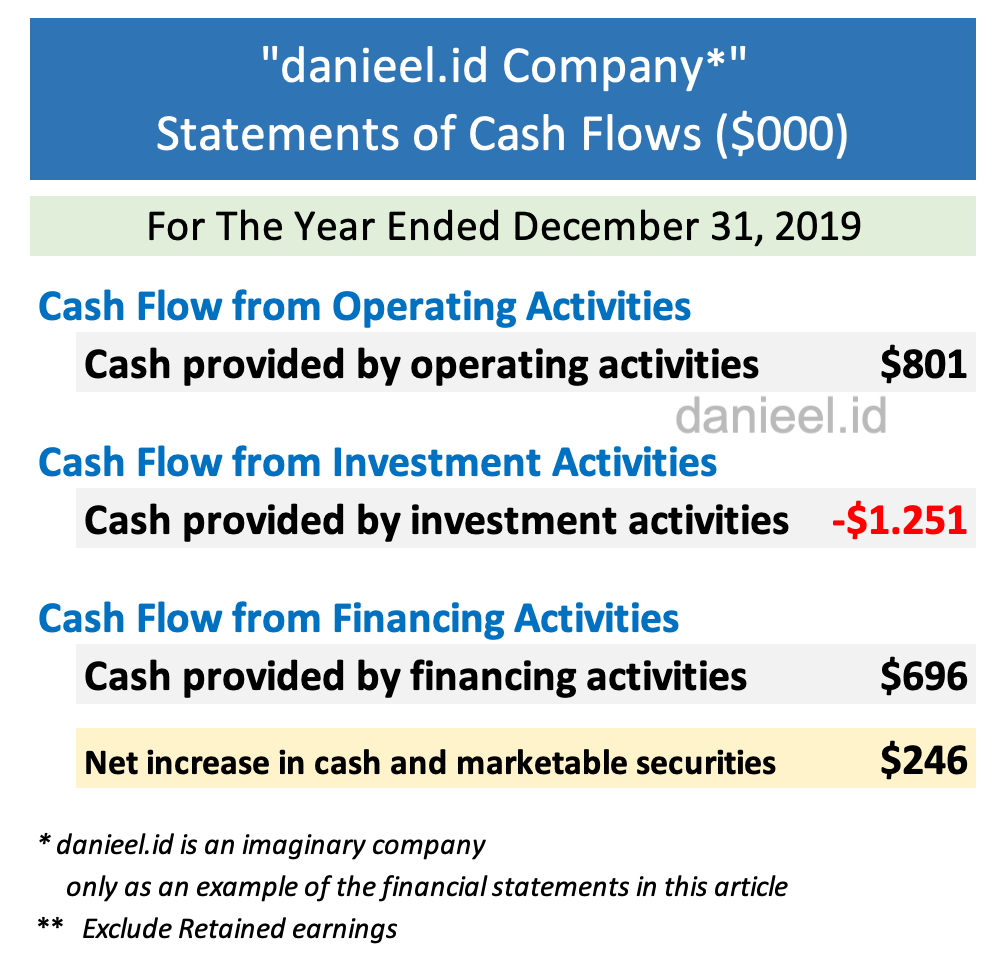
The first check when reading a cash flow statement is to make sure the three groups of activities add up to the net increase or decrease in cash:
$801 − $1,251 + $696 = $246
The numbers match. What’s more interesting is the proportion. For every $1 of cash generated by operations, the company spent about $1.56 on investments. In other words, right from the start we know danieel.id Company is expanding faster than its operating cash can fund, and the gap has to be covered from somewhere else. The next three sections dig into the details.
Cash Flow from Operating Activities
danieel.id Company’s operating cash flow of $801 comes from net income of $560, plus non-cash expenses and adjusted for changes in working capital. This section shows the cash generated or used by the company’s core business, which is making and selling goods.
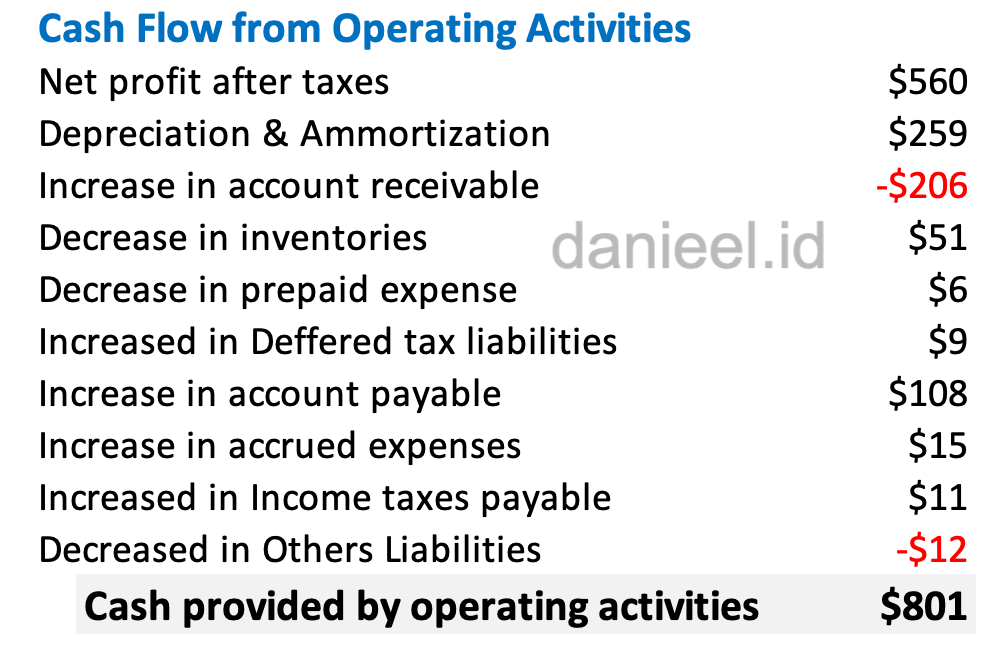
The calculation starts from net profit after taxes of $560. Depreciation and amortization of $259 are added back because both are non-cash expenses. Then comes working capital: accounts receivable rose by $206, so it’s recorded as a cash outflow, because the sales were recognized but the money hasn’t been received. On the other hand, inventories fell by $51 and prepaid expenses fell by $6. These decreases release cash that was previously tied up in the warehouse and in advance payments.
On the liabilities side, accounts payable rose by $108, accrued expenses by $15, income taxes payable by $11, and deferred tax liabilities by $9. These increases temporarily add to cash because the bills haven’t been paid in full. Only other liabilities fell, by $12. After all the adjustments, operating cash reached $801, or about $1.43 of cash for every $1 of net income. In short, the company’s profit that year was genuinely backed by cash.
To be fair, one thing deserves a closer look. Part of that cash strength came from higher accounts payable (paying suppliers later does make cash feel roomier, but suppliers have long memories). Even if the $108 increase in payables were taken out, operating cash would still be about $693, still above net income. Even so, the quality of cash flow is best judged over several periods, not just one year.
Cash Flow from Investing Activities
danieel.id Company’s investing cash flow of −$1,251 shows the company spending cash on long-term assets, mainly fixed assets. Investing activities cover buying and selling long-term assets and other investments that aren’t cash equivalents.
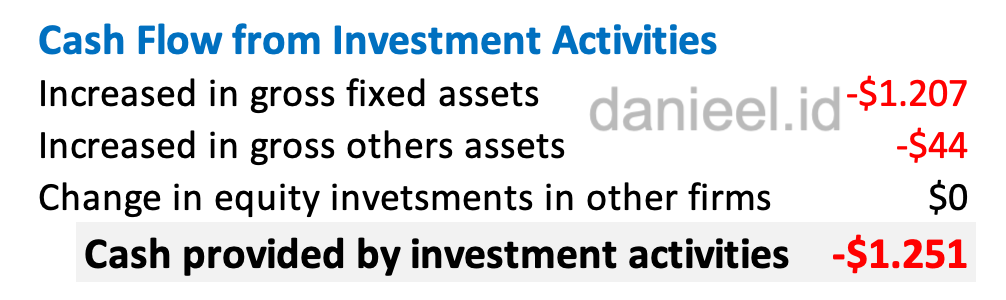
The details are simple: gross fixed assets rose by $1,207, gross other assets rose by $44, and equity investments in other firms didn’t change. From the balance sheet, we know the biggest increase was in machinery. That suggests the company is adding to or upgrading its production capacity, much like a bakery owner buying a second oven because orders are starting to pile up.
A negative investing cash flow doesn’t automatically mean the company is in trouble. The better question is whether the investment is productive. In the following periods, the new machines should raise output, efficiency, revenue, or profit. If investments keep absorbing cash without improving operating performance, that’s when we need to be careful.
On the flip side, a positive investing cash flow isn’t necessarily good news either. A positive number can appear because the company sold assets. If what it sold were productive assets, just to plug a short-term cash shortfall, its ability to earn revenue in the future gets eroded along the way.
Cash Flow from Financing Activities
danieel.id Company’s financing cash flow of $696 comes from additional long-term debt and share capital, after deducting debt repayments and dividends paid. This section answers how the company raised money from creditors and shareholders, and how that money was returned.
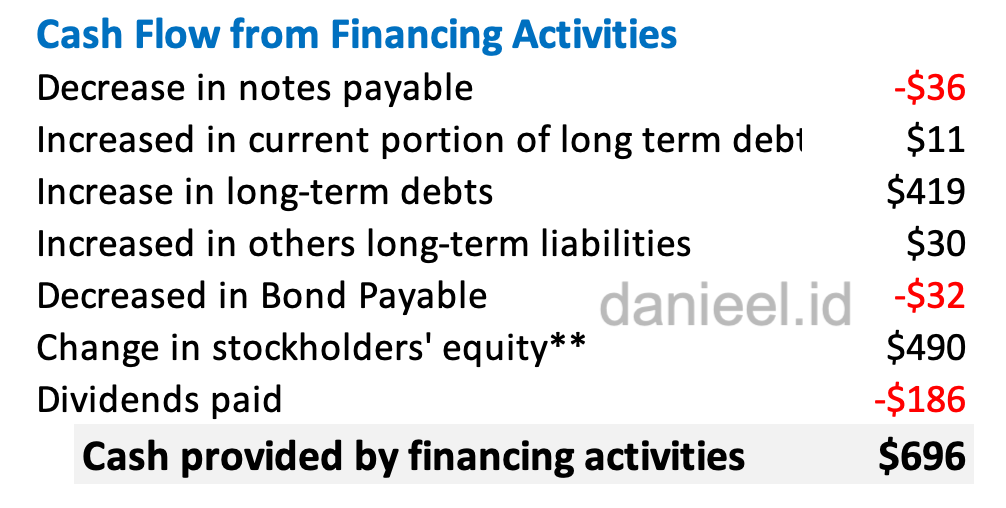
On the outflow side, notes payable fell by $36 and bonds payable fell by $32. On the inflow side, the current portion of long-term debt rose by $11, long-term debt rose by $419, and other long-term liabilities rose by $30. The change in stockholders’ equity, excluding retained earnings, added $490 of cash. The company also paid $186 in dividends to shareholders. The net result is a cash inflow of $696.
Now the pieces of the puzzle come together. Investing of $1,251 minus operating cash of $801 leaves a funding need of about $450. Financing of $696 covers that need and still leaves $246, exactly the net increase in cash. Borrowing and issuing shares like this makes sense as long as the new machines earn an adequate return and the new debt can be serviced by future cash flows.
Reading the Three Activities as One Story
When you read a cash flow statement, the three activities mean the most when read together rather than judged one by one, because each tells only part of the company’s money journey. At danieel.id Company, operations generated cash, investing spent even more, and external financing covered the gap. Here’s the summary:
| Activity | danieel.id Company 2019 | Key question |
|---|---|---|
| Operating | +$801, above $560 profit | Is profit turning into cash? |
| Investing | −$1,251, mostly machinery | Is the investment productive? |
| Financing | +$696 from debt and shares | Can the new debt be serviced? |
| Net change | +$246 | Does it match the balance sheet? |
So each row comes with one question we can put straight to any company’s report.
The last row can be matched against the balance sheet. Cash rose from $611 to $841, or $230, and marketable securities rose from $105 to $121, or $16. Together that’s $246, the same as the cash flow statement’s result. The story also fits the balance sheet: the company bought fixed assets, mostly machinery, while adding long-term debt and share capital.
In other words, the income statement shows that the company made a profit, the balance sheet shows its assets and how they’re funded, the cash flow statement explains the movement of money that links the two, and the statement of changes in equity explains changes in capital and retained earnings. The full picture is in the four types of financial statements, and the next step is calculating company financial ratios.
Common Questions About the Cash Flow Statement
Why is net income different from operating cash flow?
Net income is calculated on an accrual basis, while operating cash flow records only the money that actually came in and went out. The difference comes from non-cash items such as depreciation and from changes in receivables, inventory, and accounts payable. At danieel.id Company, a $560 profit turned into $801 of operating cash.
Is a negative investing cash flow always bad?
No; a negative investing cash flow often means the company is buying productive assets such as machinery or a factory. Judging it depends on the purpose of the investment and the results that show up in later periods, such as higher output or profit.
What is the difference between the direct and indirect methods?
The direct method itemizes operating cash receipts and payments by category, while the indirect method starts from net income and adjusts it. Total operating cash is the same. The only difference is how the operating section is presented; the investing and financing sections don’t change.
What is the first step in reading a cash flow statement?
The first step in reading a cash flow statement is to compare operating cash flow with net income. If operating cash consistently falls below profit over several years, trace receivables and inventory on the balance sheet before judging the investing and financing sections.
Closing: From Bank Statement to Business Story
Let’s go back to the building supply store owner from the beginning. The profit was real, but the money was stuck in project receivables and stock piling up in the warehouse. A cash flow statement would have shown that long before payday arrived.
That’s the heart of how to read a cash flow statement: check whether operations generate cash, understand what the investment spending is for, then see where financing covered the shortfall and match the final result with the balance sheet. At danieel.id Company, healthy operating cash became the foundation for expanding its machinery, while new debt and shares covered the rest. That’s not an investment verdict, but a business story that can be traced through the numbers.
Just like that bank transaction history, a cash flow statement rarely lies about where the money went. Try it on the annual report of a listed company you know: compare its net income with its operating cash over the last three years, then see whether the difference comes from receivables, inventory, or accounts payable. The saying “cash is king” has some truth to it, but a king locked away in a vault isn’t much use either; good cash is enough to stay safe and still put to productive work.
When you size up a company, which do you trust more if the two disagree: net income that keeps rising, or operating cash flow that keeps stalling? Share your reasoning in the comments.
Hope this helps.
This post is also available in: