







Imagine opening a small coffee shop with money from three sources: a bank loan, cash from a friend who wants a “fixed cut” every year, and your own savings. The bank charges interest, your friend waits for their payout, and your savings could have been invested somewhere else. So what is the average cost of all that capital, really?
That is where the WACC calculation comes in. WACC, or weighted average cost of capital, is the weighted average of the returns required by all of a company’s capital providers, namely lenders, preferred shareholders, and common shareholders, with each weighted by its share of the capital structure. This number is used to judge whether an investment earns a return that is worth its cost and risk.
One thing needs clearing up first: “cost” here doesn’t always mean cash leaving the business. Shareholders still expect a return even if the company pays no dividends, just like the savings in our coffee shop, which still carry an “opportunity cost”.
Disclaimer: Company X and Company Y and all example figures are fictional and for education only, not current market data and not advice to buy, sell, or hold any investment. For real decisions, check actual data and the risks involved.
The Formula Behind the WACC Calculation
The WACC calculation adds up the cost of each source of capital after multiplying it by its weight, with the cost of debt taken after tax. The full formula, as taught in the textbook Principles of Managerial Finance by Gitman and Zutter, is:
WACC = wd × kd × (1 − T) + wp × kp + we × ke
V = D + P + E; wd = D ÷ V; wp = P ÷ V; we = E ÷ V
D, P, and E are the market values of interest-bearing debt, preferred stock, and common equity. Each k is the cost of that source of capital; kd is before tax and T is the relevant marginal tax rate. The weights must add up to 100%, and without preferred stock, P and its weight are zero.
The simplest example: Company Y has a debt weight of 40% and an equity weight of 60%. If its after-tax cost of debt is 7% and its cost of equity is 12%, its WACC is (40% × 7%) + (60% × 12%) = 10%. Stressing “after tax” matters so the tax saving isn’t counted twice.

For valuation, use market value weights or a reasonable target capital structure rather than simply copying balance sheet proportions. The market value of equity is the share price multiplied by the number of shares outstanding. Debt covers interest-bearing financing, including its current portion, but not all operating liabilities such as trade payables. Retained earnings are already part of common equity, so they don’t get a separate weight.
Keep the date, currency, and annual basis of every input consistent. The article on company financial ratios helps us read leverage and the ability to cover interest before we settle on financing assumptions.
So you don’t get lost on where to start, here are five components of the WACC calculation that are closely linked, from the most “visible” to the one most often forgotten.
Cost of Debt
The cost of debt in a WACC calculation reflects the interest rate the market currently requires, not just historical interest expense divided by the debt balance. It can be estimated using the YTM of a representative bond, a benchmark rate plus a credit spread, a synthetic rating, or the rate on new borrowing.
After-tax kd = kd × (1 − T)
The tax benefit applies when interest is tax-deductible and the company is able to use it. Throughout this exercise, T = 25% is a fictional assumption, not a statement of Indonesia’s current tax rate.
Market YTM and Effective Issuance Cost
Market YTM measures the cost of debt on bonds already in circulation, while the effective issuance cost measures the cost of new bonds after deducting issuance costs. The two can differ and are best kept separate.
Company X has a bond with a par value of Rp100 million per analysis unit, a 10-year tenor, a 9.5% coupon paid annually, and a market price exactly at par. With no special features, its market YTM is 9.5%, so the after-tax cost of debt is 9.5% × 75% = 7.125%.
Bond Price = Σt=1…n [Coupon ÷ (1 + y)t] + Par Value ÷ (1 + y)n
If the issuer sells bonds at par and pays 3% in issuance costs, net proceeds come to Rp97 million. Replace the price in the formula with net proceeds; in Excel, just type =RATE(10,-9500000,97000000,-100000000) (use semicolons if your Excel settings require it). The result is 9.987984% per year, or about 7.490988% after tax; the tax treatment of issuance costs still needs to be checked.
One-off issuance costs can also be included directly in a project’s initial cash flow. Choose one approach, not both, or the cost will be counted twice. A more complete set of methods is covered in the article on how to calculate cost of debt.
Cost of Preferred Stock
In a WACC calculation, the cost of perpetual preferred stock with a fixed dividend is found by dividing the annual dividend per share by its market price, with no (1 − T) multiplier because dividends are not tax-deductible interest.
kp = Dp ÷ Pp
Voting rights and whether dividends are cumulative should be checked, because not all preferred stock is identical. Company X pays a fixed dividend of Rp300 with a market price of Rp3,000, so its cost is 10%.
For a new issue with issuance costs of Rp60 per share, net proceeds are Rp2,940 and the cost becomes Rp300 ÷ Rp2,940 = 10.204082%.
Cost of Common Stock Equity
The cost of common equity is the return shareholders require for the risk of their investment, and the two most common ways to estimate it are the Gordon Growth Model and CAPM. Using both helps us understand where the number comes from, rather than treating one formula’s result as a certainty.
Gordon Growth Model and Dividend CAGR
The Gordon Growth Model calculates the cost of equity as next year’s dividend divided by today’s share price, plus a sustainable dividend growth rate.
P0 = D1 ÷ (ke − g) → ke = D1 ÷ P0 + g
P0 is today’s share price, D1 next year’s dividend, and g dividend growth. The model requires ke > g and a fairly stable dividend pattern.
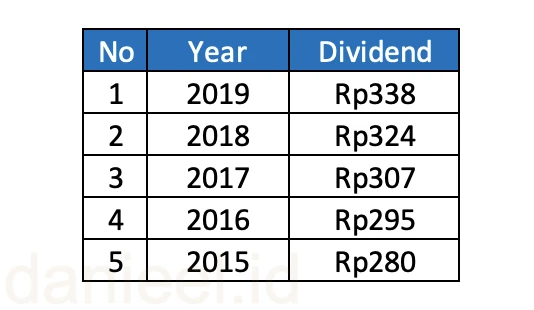
CAGR = (Ending Dividend ÷ Beginning Dividend)1/n − 1
Five annual observations from 2015 to 2019 have only four intervals (a classic trap that often throws the math off). So CAGR = (338 ÷ 280)1/4 − 1 = 4.818917%. Historical CAGR is only a clue, not a forecast.
With that g, a share price of Rp4,125, and an estimated D1 of Rp355, the cost of equity becomes 355 ÷ 4,125 + 4.818917% = 13.424977%. D1 is rounded as a practice estimate, so it doesn’t have to equal Rp338 × (1 + g) exactly.
Capital Asset Pricing Model
CAPM calculates the cost of equity as the risk-free rate plus beta multiplied by the equity risk premium (ERP).
ke = Rf + β × ERP, where ERP = E(Rm) − Rf
As a fictional alternative, an Rf of 6%, a beta of 1.2, and an ERP of 6% give a cost of equity of 13.2%. Beta only measures sensitivity to the market, and the ERP is a forward-looking estimate, not a guarantee based on historical returns. The components of CAPM are explained in detail in the article on cost of equity with CAPM. CAPM and Gordon results don’t have to match, and there’s no need to average them without a reason.
Cost of Retained Earnings
The cost of retained earnings equals the cost of common equity, because shareholders are effectively giving up the chance to receive that money and invest it elsewhere at comparable risk.
kr = ke
So retained earnings aren’t free capital (even if they feel like “our own money”, haha). In the Company X exercise, their cost is 13.424977%. Because retained earnings are already part of equity, don’t add common stock and retained earnings as two separate market value weights.
Cost of a New Issue of Common Stock
The cost of issuing new shares is calculated from the net proceeds the company receives, so it comes out higher than the cost of equity based on the market price.
Ne = P0 − u − f; knew = D1 ÷ Ne + g
u is the difference between the market price and the issue price, while f is the issuance cost per share. If the market price is Rp4,125, the issue price Rp4,000, and issuance costs Rp100, net proceeds are Rp3,900. The cost becomes 355 ÷ 3,900 + 4.818917% = 13.921481%.
Still, don’t rush to conclude that new shares are always the most expensive source of funding for every company.
A Worked WACC Calculation for Company X
With fictional market value weights of 50% debt, 10% preferred stock, and 40% common equity, the WACC calculation for Company X gives about 9.93%. The cost of equity comes from the Gordon Growth Model, and all costs use a market basis without issuance costs to stay consistent.
| Source (weight) | Cost | Contribution |
|---|---|---|
| After-tax debt (50%) | 7.125000% | 3.562500% |
| Preferred stock (10%) | 10.000000% | 1.000000% |
| Common equity (40%) | 13.424977% | 5.369991% |
| Total (100%) | WACC | 9.932491% |
WACC = (50% × 7.125%) + (10% × 10%) + (40% × 13.424977%) ≈ 9.93%
Keep full precision while calculating, then round the final result. If the cost of equity is replaced with the CAPM result of 13.2%, the WACC becomes 9.8425%. In other words, the cost of equity assumption helps shape the outcome of the WACC calculation.
WACC Example: danieel.id Company
The WACC of danieel.id Company is 10.08%, combining an after-tax cost of debt of 6.02%, a cost of preferred stock of 10.0%, and a cost of equity of 11.2%, each weighted by market value. This company is imaginary, not a real one. It is the same single example used throughout the financial statement analysis guide, the e-book, and the danieel.id videos, so its numbers can be followed from the income statement all the way to stock valuation.
The table below shows the weight, cost, and contribution of each source of capital of danieel.id Company to its WACC.
| Source of capital | Weight × cost | Contribution |
|---|---|---|
| Debt (after tax) | 20.8% × 6.02% | 1.25% |
| Preferred stock | 3.1% × 10.0% | 0.31% |
| Common stock | 76.0% × 11.2% | 8.52% |
| WACC | 100% | 10.08% |
In other words, any investment by danieel.id Company with the same risk as its core business must earn at least about 10.1% a year. Because common stock makes up three quarters of its capital structure, the WACC of danieel.id Company is most sensitive to changes in the cost of equity.
Using WACC for Investment and Valuation
WACC is used as the discount rate for free cash flow available to all capital providers, or free cash flow to firm (FCFF), while cash flow to shareholders (FCFE) is discounted at the cost of equity. Mixing the two can produce a misleading valuation.
Project NPV = −Initial Investment + Σt=1…n [FCFFt ÷ (1 + WACC)t]
For projects with comparable risk and conventional cash flow patterns, an IRR above WACC supports accepting the project. However, NPV is more reliable when there are multiple IRRs or the projects are mutually exclusive, and riskier projects need a higher discount rate. In company valuation, the present value of FCFF still needs to be adjusted for non-operating assets and for debt and preferred stock claims. This match between cash flows and discount rates is explained in Aswath Damodaran’s valuation materials.
For a real WACC calculation, take audited reports and debt notes from the financial and annual reports on the Indonesia Stock Exchange (IDX) or the issuer’s official website. Check bond prices and yields at PHEI, Indonesia’s bond pricing agency, and current ratings at PEFINDO, an Indonesian credit rating agency. Record the date, source, currency, and reasoning behind every assumption, because WACC can change along with financing conditions and business risk.
This article covers stage 7 of the eight stages in our step-by-step guide to financial statement analysis. If you’d like to learn in order, from the basic statements all the way to stock valuation, start with its roadmap.
Common Questions About WACC
What is WACC?
WACC (weighted average cost of capital) is the weighted average cost of all of a company’s sources of capital, namely debt, preferred stock, and common equity. It sets the minimum return an investment needs to earn so it doesn’t hurt the capital providers.
Why is the cost of debt taken after tax in a WACC calculation?
Interest on debt is generally deductible from taxable income, so its real cost is lower. That’s why the cost of debt is multiplied by (1 − T), while preferred dividends and equity are not.
Should WACC weights use book value or market value?
Ideally market value or a reasonable target capital structure. The book value of debt can be used if its market value is hard to obtain, as long as the reason is explained.
What is considered a good WACC?
There’s no standard number, because WACC depends on the industry, business risk, capital structure, and interest rate conditions. What matters is that a project’s return exceeds WACC at comparable risk.
From a Coffee Shop to Company Valuation
Back to that coffee shop. The bank interest, the “fixed cut” for your friend, and the opportunity cost of your own savings can all be summed up in a single number. That is the WACC calculation: the after-tax cost of debt, the cost of preferred stock, and the cost of equity, including retained earnings and new shares, each weighted by its share.
The key isn’t just adding up percentages, but making sure every input and cash flow is on the same basis. The first step is simple: copy the Company X table into Excel, replace the weights and costs with data from a company you’re interested in, then see how far the result of your WACC calculation shifts when the cost of equity changes by one percentage point.
In your view, which component is hardest to estimate when doing a WACC calculation for a real company: the cost of debt, beta, or dividend growth? Share it in the comments; your experience might help other readers who are learning valuation.
Hope this helps.
This post is also available in: