







Picture two hardware stores at the end of the same street, both reporting an ROE of 15%. The first one makes a fat profit on every bag of cement it sells. The second one earns only thin margins, but its owner has put in very little capital, because almost all of its stock was bought on credit from the distributor. On paper, the two look like twins, yet their financial “health” is worlds apart.
That is exactly why DuPont Analysis is worth learning. DuPont Analysis is a method of breaking ROE (Return on Equity) down into three components: net profit margin, total asset turnover, and the financial leverage multiplier. Instead of stopping at “is this number good or not?”, it pushes us toward the more important question: where did this result actually come from?
Think of ROE as a child’s average grade on a school report card. An average of 80 looks great, but it only means something once we open up the grades for each subject: is the child genuinely strong at math, or is the average being propped up by a single subject? DuPont Analysis is how we open that report card.
Interestingly, this formula came from an engineer, not an accountant. According to the Hagley Museum and Library’s profile of Donaldson Brown, this electrical engineering graduate joined the DuPont company in 1908 as a sales representative in its Explosives Department, and in 1914, while serving as assistant treasurer, developed a formula he called return on investment. It later became known as the DuPont Method (good news for those of us without an accounting background, haha).
If terms like balance sheet and income statement still feel unfamiliar, you may want to stop by the articles on the four types of financial statements and company financial ratios first. Our example still uses the imaginary company “danieel.id/ Company”.
What Are ROA and ROE in DuPont Analysis?
ROA measures how much profit a company generates from all of its assets, while ROE measures how much profit it generates from common stockholders’ equity. In DuPont Analysis, both use the same numerator: earnings available for common stockholders (the profit left for common shareholders after preferred stock dividends).
ROA = Earnings Available for Common Stockholders ÷ Total Assets × 100%
ROE = Earnings Available for Common Stockholders ÷ Common Equity × 100%
The part people often overlook is the denominator of ROE. Common equity includes common stock, additional paid-in capital, and retained earnings, so it is not just the par value of common stock. In a company that has preferred stock, common equity is also smaller than total equity.
The Financial Statements of danieel.id/ Company
All of the DuPont Analysis calculations below use the 2019 income statement and balance sheet of danieel.id/ Company, stated in thousands of dollars ($000).
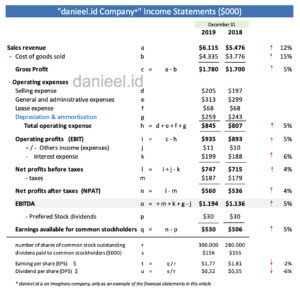
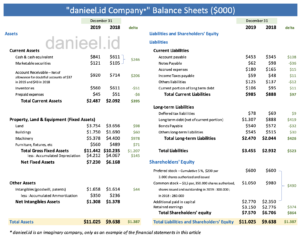
From these two statements, we only need five figures for 2019: sales of $6,115, earnings available for common stockholders of $530, total assets of $11,025, total liabilities of $3,455, and total equity of $7,570. Since there is $600 of preferred stock, common equity comes to $7,570 − $600 = $6,970. How to read each line item in more detail is covered in how to read an income statement and how to read a company balance sheet.
The DuPont Formula: Breaking Down ROA into Margin and Asset Turnover
The first stage of DuPont Analysis breaks ROA down into the product of net profit margin and total asset turnover. The margin shows the share of sales left over as profit for common stockholders, while asset turnover shows how much in sales the company’s assets generate.
Net Profit Margin = Earnings Available for Common Stockholders ÷ Sales × 100%
Total Asset Turnover = Sales ÷ Total Assets
ROA = Net Profit Margin × Total Asset Turnover
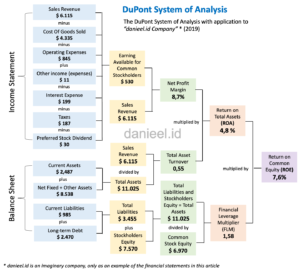
Following the diagram, net profit margin = $530 ÷ $6,115 × 100% ≈ 8.7%. Total asset turnover = $6,115 ÷ $11,025 ≈ 0.55 times. So ROA = 8.7% × 0.55 ≈ 4.8%. If we calculate it directly, $530 ÷ $11,025 × 100% also gives about 4.8%. It checks out, right?
To bring these numbers down to earth: a margin of 8.7% means that out of every $100 in sales, about $8.70 is left as profit for common stockholders. A turnover of 0.55 times means every $1 of assets generates about 55 cents in sales over a year. So an ROA of 4.8% combines “how profitable each sale is” with “how productive each asset is”.
Wait, if we end up with the same answer as the direct formula, why bother splitting it up? Take a look at the full formula:
ROA = (Earnings for Common Stockholders ÷ Sales) × (Sales ÷ Total Assets) × 100%
= Earnings for Common Stockholders ÷ Total Assets × 100%
Sales in the numerator and denominator do cancel each other out, but separating them reveals the source of any change in ROA: whether the company is losing margin, or whether its assets are not generating enough sales.
Improving net profit margin
Net profit margin can be improved through pricing, product mix, and cost control. In the diagram, sales of $6,115 minus COGS of $4,335 and operating expenses of $845, plus other income of $11, minus interest of $199, taxes of $187, and preferred dividends of $30, leaves earnings available for common stockholders of $530.
Raising prices obviously has to take customers’ purchasing power and competitors into account. Cutting costs also calls for care. Postponing machine maintenance or scaling back customer service can make this year’s profit look pretty, but the bill arrives later in the form of disrupted production and customers who move elsewhere. So what we are looking for are costs that do not deliver proportional benefits, not simply the costs that are easiest to cut.
Increasing total asset turnover
Total asset turnover can be increased by generating more sales from existing assets, optimizing factory capacity, disposing of unproductive assets, or investing only in assets that can generate adequate sales. Marketing programs also need to be evaluated after accounting for discounts and their additional costs.
Low-margin businesses, such as convenience stores, usually rely on goods that move quickly. Conversely, asset-heavy businesses, such as cement plants or toll roads, generally need higher margins. This pattern is not an absolute rule. Compare against companies with a similar business model before judging a number as good or bad.
The Modified DuPont Formula: From ROA to ROE
The second stage of DuPont Analysis links ROA to ROE through the Financial Leverage Multiplier (FLM), also called the equity multiplier. In this example, the FLM is calculated using common equity so that it matches the denominator of ROE.
FLM = Total Assets ÷ Common Equity
ROE = ROA × FLM
ROE = Net Profit Margin × Total Asset Turnover × FLM
The FLM of danieel.id/ Company is $11,025 ÷ $6,970 ≈ 1.58 times. Therefore, ROE = 4.8% × 1.58 ≈ 7.6%. The direct formula, $530 ÷ $6,970 × 100%, also gives about 7.6%. In everyday terms, every $1 of common stockholders’ equity “supports” about $1.58 of assets, and every $100 of that equity generates about $7.60 of profit in a year.
ROE = (Earnings for Common Stockholders ÷ Sales) × (Sales ÷ Total Assets) × (Total Assets ÷ Common Equity) × 100%
= Earnings for Common Stockholders ÷ Common Equity × 100%
Total assets always equal total liabilities plus total equity; in the diagram, $3,455 + $7,570 = $11,025. However, the FLM denominator remains $6,970, not $7,570, because total equity still includes $600 of preferred stock. This means the FLM here is influenced by two types of funding outside common equity, namely liabilities and preferred stock, and the two should be kept apart when reading the result.
A simple example of how liabilities affect ROE
A larger share of liabilities pushes the FLM higher, and at the same ROA, ROE gets pushed up along with it. Still confused? Let’s use two simple companies with no preferred stock. Company A has assets of $10, equity of $8, and liabilities of $2, so its FLM is 10 ÷ 8 = 1.25 times. Company B has the same $10 in assets, but equity of $6 and liabilities of $4, so its FLM is 10 ÷ 6 ≈ 1.67 times.
Let’s say both have an ROA of 5%. Company A’s ROE becomes 5% × 1.25 ≈ 6.3%, while Company B’s ROE becomes 5% × 1.67 ≈ 8.3%. At first glance B looks more impressive, even though its assets generate profit exactly as well as A’s.
High leverage also brings risk
A high FLM magnifies ROE, but it also magnifies interest expense and payment obligations. To be fair, the example above assumes ROA stays at 5%, whereas in reality ROA does not automatically hold steady when the funding structure changes. Interest on loans also reduces profit, and investments financed with debt can fail to generate enough profit, so ROE may actually fall (back to our hardware store: the stock piles up, but the installments to the distributor keep coming).
That is why the results of DuPont Analysis should be read alongside DER (debt to equity ratio), interest coverage, fixed payment coverage, and cash flow. Industry averages do provide context, but being below average does not guarantee that a company can safely take on more debt. Maturity schedules, revenue stability, and investment needs also matter. If you want to go a step further, the cost of each funding source can be traced through the WACC calculation.
Reading DuPont Analysis Results as a Whole
The DuPont Analysis results for danieel.id/ Company in 2019 can be summarized as three components that multiply together to produce an ROE of 7.6%. The table below summarizes all of the calculations above, along with what they mean.
| Component | 2019 result | Plain meaning |
|---|---|---|
| Net profit margin ($530 ÷ $6,115) | 8.7% | $8.70 profit per $100 of sales |
| Total asset turnover ($6,115 ÷ $11,025) | 0.55 times | 55 cents of sales per $1 of assets |
| ROA (margin × turnover) | 4.8% | $4.80 profit per $100 of assets |
| FLM ($11,025 ÷ $6,970) | 1.58 times | Each $1 of common equity supports $1.58 of assets |
| ROE (ROA × FLM) | 7.6% | $7.60 profit per $100 of common equity |
From this table, the next steps are clear. If the margin falls, look into prices and costs. If turnover slows, check asset productivity. If the multiplier rises, examine the funding structure and its payment burden.
One technical point is worth noting: some textbooks, including OpenStax in its chapter Profitability Ratios and the DuPont Method, also discuss using average balances for assets and equity (the opening balance plus the closing balance for the year, divided by two). The example here uses year-end 2019 balances, following the framework of Gitman and Zutter in Principles of Managerial Finance (13th edition), to keep things simple. What matters is using the same method whenever you compare.
Frequently Asked Questions about DuPont Analysis
What is DuPont Analysis in simple terms?
DuPont Analysis is a way of breaking ROE down into three components: profit margin, asset turnover, and the equity multiplier. This breakdown shows whether a company’s ROE is strong because it profits from its sales, uses its assets efficiently, or relies mainly on a lot of funding from sources other than common stockholders’ equity.
What is the difference between ROA and ROE?
ROA compares profit with all of a company’s assets, while ROE compares profit with common stockholders’ equity. The gap between the two is explained by the financial leverage multiplier; for danieel.id/ Company, an ROA of 4.8% becomes an ROE of 7.6% because its FLM is 1.58 times.
Does a high ROE always mean a good company?
A high ROE does not necessarily mean a good company, because the number can be inflated by heavy debt. Two companies with the same ROA can have different ROEs simply because their funding structures differ, so check their DER, ability to pay interest, and cash flow as well.
Why does ROE use common equity instead of total equity?
ROE uses common equity because its numerator is the profit available to common stockholders, after preferred stock dividends. So that the numerator and denominator “talk about” the same group of owners, the preferred stock portion is removed from total equity; in this example, $7,570 − $600 = $6,970.
So, Where Does That 7.6% ROE Come From?
In short, danieel.id/ Company’s ROE of 7.6% is built from a profit margin of 8.7%, an asset turnover of 0.55 times, and an equity multiplier of 1.58 times. Margin and asset turnover produce an ROA of 4.8%; funding from liabilities and preferred stock then “multiplies” it into ROE.
Back to the two hardware stores at the start of this article: the same ROE can hide very different stories. Just like a child’s report card, an average grade only becomes useful once we know the grade for each subject, and DuPont Analysis gives us that “grade sheet”. The first step is simple: take the financial statements of a company you know, calculate the three components, and compare them with the previous year.
The results may not answer everything right away, but at least we will know which question to ask next. And in financial analysis, the right question is often worth more than a number that merely looks good.
If you try breaking down the ROE of a company whose shares you hold, or the company you work for, which component most often “rescues” the number: margin, asset turnover, or debt? I’d love to read your answer in the comments.
Note: this article is general education on financial statement analysis and is not investment advice.
Happy calculating!
This post is also available in: