







What does a company actually own, and where did the money to buy it come from? The answers to those two simple questions sit on one page of the financial statements that people skip most often, because it looks like a wall of accounts and numbers written in a foreign language. That page is the balance sheet.
The good news is that how to read a balance sheet is not nearly as hard as it looks. A balance sheet, also called the statement of financial position, is a report that shows a company’s assets, liabilities, and equity on one specific date. Once you understand how those three fit together, the balance sheet starts to read like a story: what the company owns, who financed it, and what has changed since last year.
The easiest way to think about it: a balance sheet is a photo, not a video. The income statement records performance over a whole period, say from January 1 to December 31, while the balance sheet captures the company’s financial condition at the exact reporting date, say December 31. That is why comparing two photos taken a year apart is the heart of how to read a balance sheet: it shows which way things are moving.
Under IAS 1 on the presentation of financial statements, adopted in Indonesia as PSAK 201, the statement of financial position is part of a complete set of financial statements. From 2027, IAS 1 will be replaced by IFRS 18, and Indonesia’s accounting standards board (DSAK IAI) has approved PSAK 118 as its local equivalent. The big changes are in the income statement; the current and non-current split on the balance sheet stays in place.
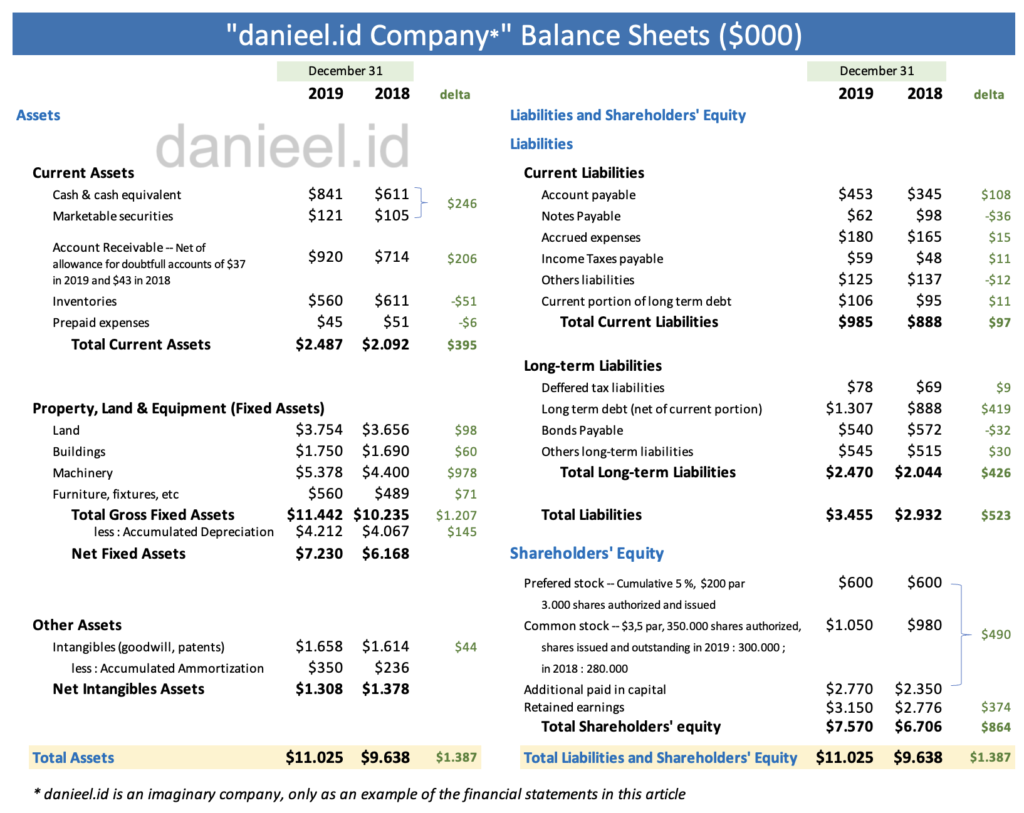
For our example, we will use an imaginary manufacturing company called danieel.id Company. All figures are in thousands of US dollars ($000), exactly as shown in the balance sheet image below, and the format follows the examples in Principles of Managerial Finance by Lawrence J. Gitman and Chad J. Zutter (13th edition). It is for learning only, not investment advice. So, what should we pay attention to? There are at least five parts, and we will start with the most fundamental one.
How to Read a Balance Sheet Using the Basic Equation
The first step in learning how to read a balance sheet is understanding its basic equation: total assets always equal total liabilities plus shareholders’ equity.
Assets = Liabilities + Shareholders’ Equity
This equation says that every asset a company owns is financed by one of two sources. The first is money from other parties, which becomes the company’s obligations. The second is money that belongs to the owners or shareholders. Because every asset must have a source of financing, the two sides of the balance sheet always balance, just as the name suggests.
In the 2019 example, total assets of $11,025 equal total liabilities of $3,455 plus total equity of $7,570. For 2018, total assets of $9,638 likewise equal liabilities of $2,932 plus equity of $6,706. The delta column in the image shows the change between the two years, so the items that moved the most stand out right away.
Keep in mind, though, that a balanced balance sheet does not mean the company is healthy. It only shows that the bookkeeping follows the basic accounting relationship. A company in trouble still has a balanced balance sheet; its debt simply swells while its equity shrinks. So what we really need to read is the composition and how it changes.
Understanding Assets
Assets are the first block to master in how to read a balance sheet: they are economic resources controlled by a company as a result of past events that have the potential to produce economic benefits. In the IFRS Conceptual Framework, assets, liabilities, and equity are the basic elements used to describe a company’s financial position.
Current assets
Current assets are cash and other assets expected to be realized, sold, or used up within the normal operating cycle, usually within one year. In this example, they are listed starting with cash and cash equivalents, then marketable securities, accounts receivable, inventories, and prepaid expenses. If you are learning how to read a balance sheet, this liquidity-based order helps us move from the assets that turn into cash most easily to those that take longer.
Total current assets rose from $2,092 in 2018 to $2,487 in 2019, an increase of $395 (about 19%). Cash and marketable securities together grew by $246. That improvement in liquidity looks positive, but the balance sheet does not explain where the money came from; for that, we need to look at the cash flow statement.
Accounts receivable increased by $206, from $714 to $920, or almost 29% in a single year. Rising receivables can follow growth in credit sales, but the cash has not reached the company yet (the sale is on the books, while the payment is still at the “I’ll transfer it after payday” stage). Interestingly, the allowance for doubtful accounts shown under this item actually fell from $43 to $37. That is why readers should compare receivables with revenue growth and the company’s collection policy.
Non-current assets
Non-current assets are assets used to support the company’s operations over the long term. For this manufacturing company, the largest group consists of land, buildings, machinery, and furniture and fixtures. Accumulated depreciation is subtracted from gross fixed assets to arrive at net fixed assets, which in 2019 made up about two-thirds of total assets.
Total gross fixed assets rose by $1,207, from $10,235 to $11,442. The biggest addition came from machinery, which increased by $978. After subtracting $145 in additional accumulated depreciation, net fixed assets grew from $6,168 to $7,230, an increase of $1,062. This suggests the company made a sizable investment in its operating capacity. Whether it pays off can only be judged once sales and profit follow.
The company also held net intangible assets (goodwill and patents) of $1,308 in 2019, down $70 from $1,378. The decline happened because accumulated amortization grew by $114, more than the $44 increase in gross intangible assets.
Understanding Liabilities
Liabilities are a company’s economic obligations to creditors, suppliers, employees, the government, and other parties. For anyone learning how to read a balance sheet, the timing of those obligations matters a great deal, because it determines how quickly the company must have cash ready to settle them.
Current liabilities
Current liabilities are obligations that generally must be settled within one year or within the normal operating cycle. In the example, this group consists of accounts payable, notes payable, accrued expenses, income taxes payable, other liabilities, and the current portion of long-term debt.
Total current liabilities rose by $97, from $888 to $985. A $108 increase in accounts payable was the largest contributor, while notes payable fell by $36. Higher accounts payable is not necessarily bad; the company may have secured longer payment terms from its suppliers, much like a small neighborhood shop that is allowed to pay its wholesaler only after the goods have sold.
Long-term liabilities
Long-term liabilities are obligations that fall due in more than one year, such as long-term bank loans and bonds. They rose from $2,044 to $2,470, an increase of $426. The largest increase came from long-term debt net of the current portion, which grew by $419. Bonds payable actually fell by $32, while other long-term liabilities rose by $30 and deferred tax liabilities by $9.
Overall, total liabilities increased by $523 to $3,455. This shows that part of the asset growth was financed with additional obligations, mainly long-term borrowing. That is not automatically bad. Debt can help a company fund investment, but its ability to pay the interest and principal still needs to be checked against profit and cash flow.
In Islam, the duty to repay debt is taken seriously. The Prophet Muhammad (peace be upon him) said, “The believer’s soul is suspended by his debt until it is settled for him” (Jami’ at-Tirmidhi 1078). The hadith is about personal responsibility, not financial analysis, but the spirit is the same: debt calls for being ready to repay it.
Understanding Shareholders’ Equity
Shareholders’ equity, the last piece in how to read a balance sheet, is the owners’ residual interest in the company’s assets after all liabilities have been deducted. In this example, equity consists of preferred stock, common stock, additional paid-in capital, and retained earnings, with the total rising by $864, from $6,706 to $7,570.
Preferred stock stayed at $600. Common stock rose from $980 to $1,050, while additional paid-in capital rose from $2,350 to $2,770. Together, those two changes added $490 in capital from issuing 20,000 new shares (from 280,000 to 300,000 shares), or about $24.50 per share. Retained earnings also increased by $374, from $2,776 to $3,150.
From the same figures, we can calculate book value per common share: total equity minus preferred stock, divided by the number of common shares. The result rose from about $21.81 per share in 2018 to about $23.23 in 2019.
In learning how to read a balance sheet, retained earnings is the item people misunderstand most often, yet it is not the same as the amount of cash in the company’s bank account. It is the accumulated profit that has not been paid out as dividends and has already been put to work in various assets or business needs, such as machinery, inventory, or receivables. How it changes can be explored further through the statement of changes in equity.
Reading Balance Sheet Changes as One Story
The most important part of learning how to read a balance sheet is not memorizing the definition of every account, but connecting the changes between them. At danieel.id Company, total assets grew by $1,387 (about 14%), financed by an additional $523 in liabilities and $864 in equity. In other words, about 38% of the asset growth came from obligations and 62% from owners’ capital.
The story in this example is fairly clear. The company added $978 in machinery and $1,207 in gross fixed assets overall. At the same time, long-term debt rose by $419 and the new shares raised $490. This indicates that the machinery investment was funded by a combination of long-term borrowing and new capital, while equity also strengthened through higher retained earnings.
To test that story, several indicators can be calculated directly from the example balance sheet:
| Indicator (formula) | 2019 | 2018 |
|---|---|---|
| Current ratio (current assets ÷ current liabilities) | 2.52x | 2.36x |
| Quick ratio (cash + securities + receivables ÷ current liabilities) | 1.91x | 1.61x |
| Net working capital (current assets − current liabilities) | $1,502 | $1,204 |
| Debt to equity ratio (liabilities ÷ equity) | 0.46 | 0.44 |
On the short-term side, current assets of $2,487 are far larger than current liabilities of $985. A current ratio of about 2.52x means each $1 of current obligations is “covered” by about $2.52 of current assets, and a quick ratio of 1.91x shows that those obligations would still be covered even without selling any inventory. Still, cash is much easier to use than uncollected receivables.
The debt to equity ratio (DER) for 2019 was about 0.46, slightly higher than 0.44 in 2018. This means that for every $1 of equity, the company carries about $0.46 in liabilities. A value below 1 shows that equity is larger than liabilities, but what counts as “good” or “bad” still depends on the industry, business model, cash flow stability, and cost of debt (investors are not fortune tellers who can judge a company from a single number, he2x).
The balance sheet shows the ending position, not every cause behind it. To see whether the new machinery generates sales and profit, look at the income statement.
Frequently Asked Questions
How to read a balance sheet as a beginner?
The simplest answer to how to read a balance sheet as a beginner is to start with three questions: what the company owns, how much it owes, and how much belongs to the owners. After that, compare the figures with the previous year and look for the items that changed the most, because that is usually where the business story is hiding.
What is the difference between a balance sheet and an income statement?
A balance sheet shows the financial position on one specific date, while an income statement shows revenue, expenses, and profit or loss over a period. If the balance sheet is a photo taken on December 31, the income statement is a recording of the whole year’s journey.
Why must a balance sheet balance?
A balance sheet must balance because every asset has a source of financing, either liabilities or equity. If total assets do not equal total liabilities plus equity, there is almost certainly a recording error.
Are retained earnings the same as cash?
No. Retained earnings are accumulated profits that have not been paid out as dividends, and that money may already have been used to fund receivables, inventory, machinery, or other assets.
Conclusion: From One Photo to One Story
In short, how to read a balance sheet comes down to five habits: check the basic equation, understand assets from the most liquid, sort liabilities by their due dates, trace where equity growth came from, and compare the figures across periods to find the story behind the changes.
In the danieel.id Company example, asset growth shows up mainly as investment in machinery. It was financed by a mix of long-term debt, new share capital, and retained earnings. Short-term liquidity improved, while the debt to equity ratio rose slightly. This is not a final investment verdict, but an example of how one financial photo can be read as a sensible business story, as long as we are willing to put it side by side with last year’s photo.
The first step is simple: download the financial statements of one listed company whose products you use every day, for example from the Indonesia Stock Exchange or your local exchange, then practice how to read a balance sheet on its last two years using the five parts above. An overview of the four main reports, namely the income statement, balance sheet, statement of changes in equity, and cash flow statement, is available in the article 4 Types of Financial Statements and How to Read Them.
When you read a company’s balance sheet, which item makes you wonder the most: ballooning receivables, long-term debt, or retained earnings? Share your experience below; your answer might help other readers who are still learning.
Happy practicing, and stay critical.
This post is also available in: