





READY-TO-USE EXCEL TEMPLATE
Financial Statements and Stock Valuation Excel Template
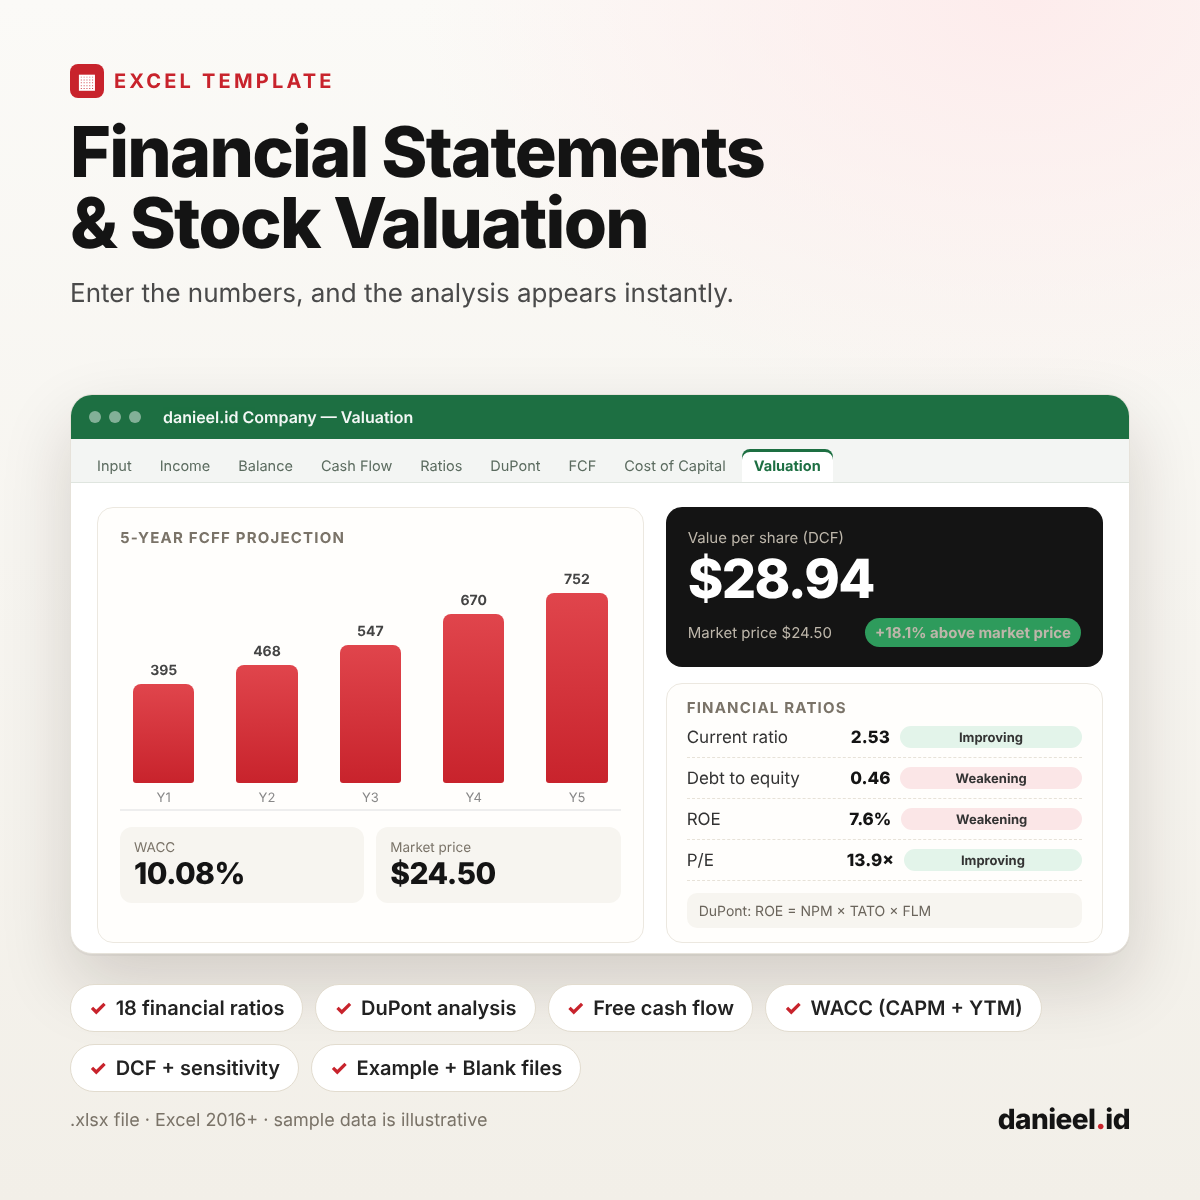
From financial statements to a stock’s fair value. The formulas are already built in, so you just enter the numbers and focus on what they mean.
| Format | Excel file (.xlsx) |
| What you get | 2 files: an Example version (filled with danieel.id Company data) and a Blank version |
| Coverage | 4 linked financial statements, 18 ratios with automatic evaluation, DuPont analysis, free cash flow, WACC, and stock valuation (DCF, DDM, market multiples) |
| Software | Microsoft Excel 2016 or later (recommended); usually also opens in Google Sheets |
| Language | English (an Indonesian version is sold separately) |
| Price | US$3.99 |
| Delivery | Instant download once payment is confirmed |
| Status | Available |
What Is This Template For?
Reading financial statements is not really about memorizing formulas. The hard part is making everything connect: net income has to flow into the balance sheet, the cash flow statement has to reconcile with the change in cash, and the ratios, cost of capital, and valuation all have to use the same numbers. Build it from scratch and one wrong cell can throw your fair value way off (and you usually only find it after a whole evening of hunting 😄).
This template takes care of that technical part. Every formula and every link between the statements is already in place, so you simply enter a company’s numbers and the analysis appears. Your time goes to what matters more: understanding the story behind the numbers.
What’s Inside
1. One input sheet, four financial statements
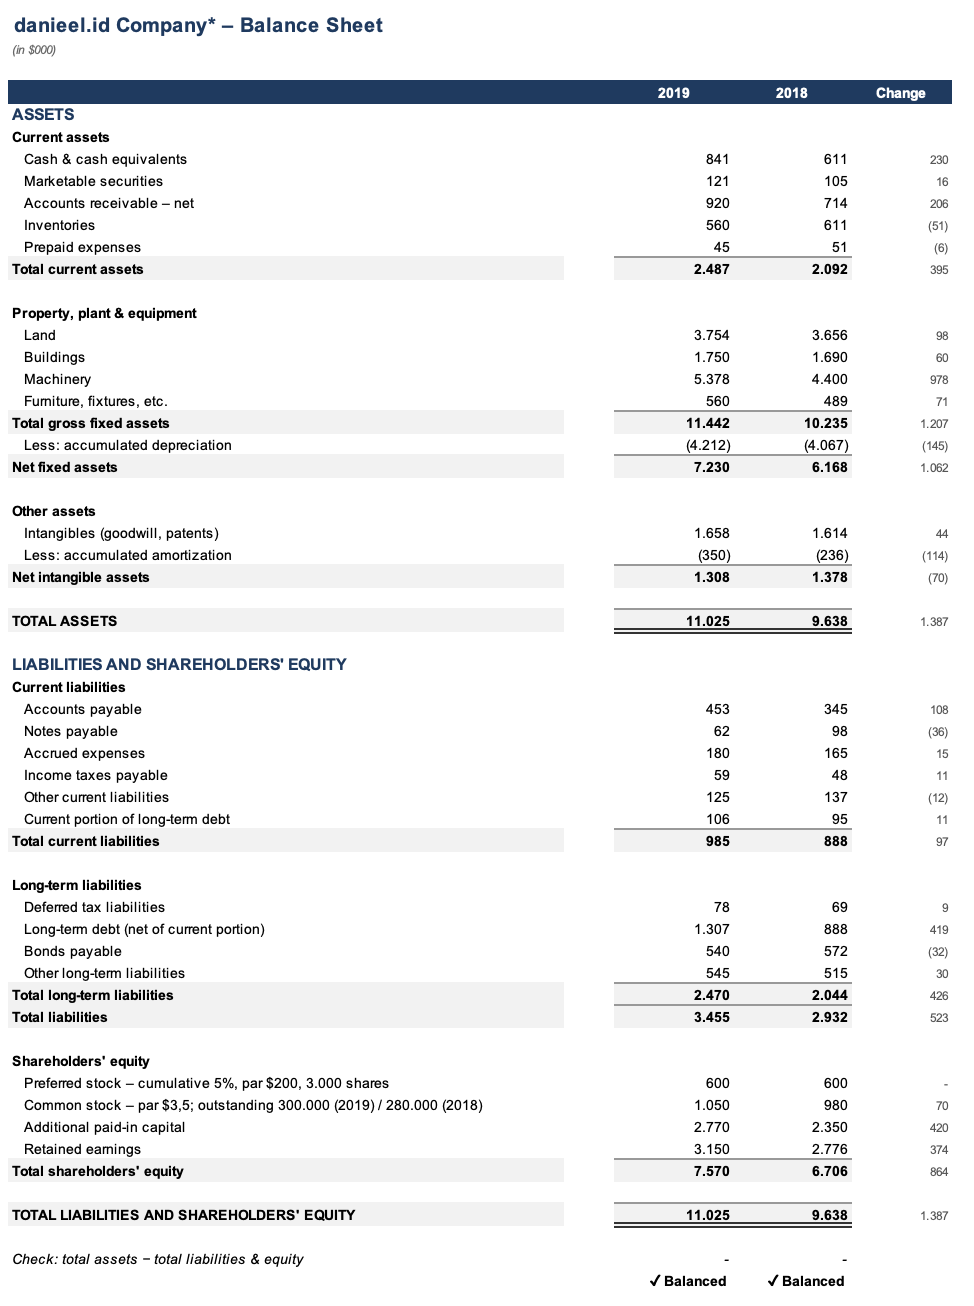
All raw data goes into a single Input sheet, in yellow cells for the current and prior year. From there the template builds the income statement (including EBITDA, EPS, and dividends per share), a two-year balance sheet, the statement of changes in equity, and an indirect-method cash flow statement. Built-in checks tell you whether the balance sheet is “✓ Balanced” and the cash flow “✓ Reconciled”, so typos get caught quickly.
2. Eighteen financial ratios
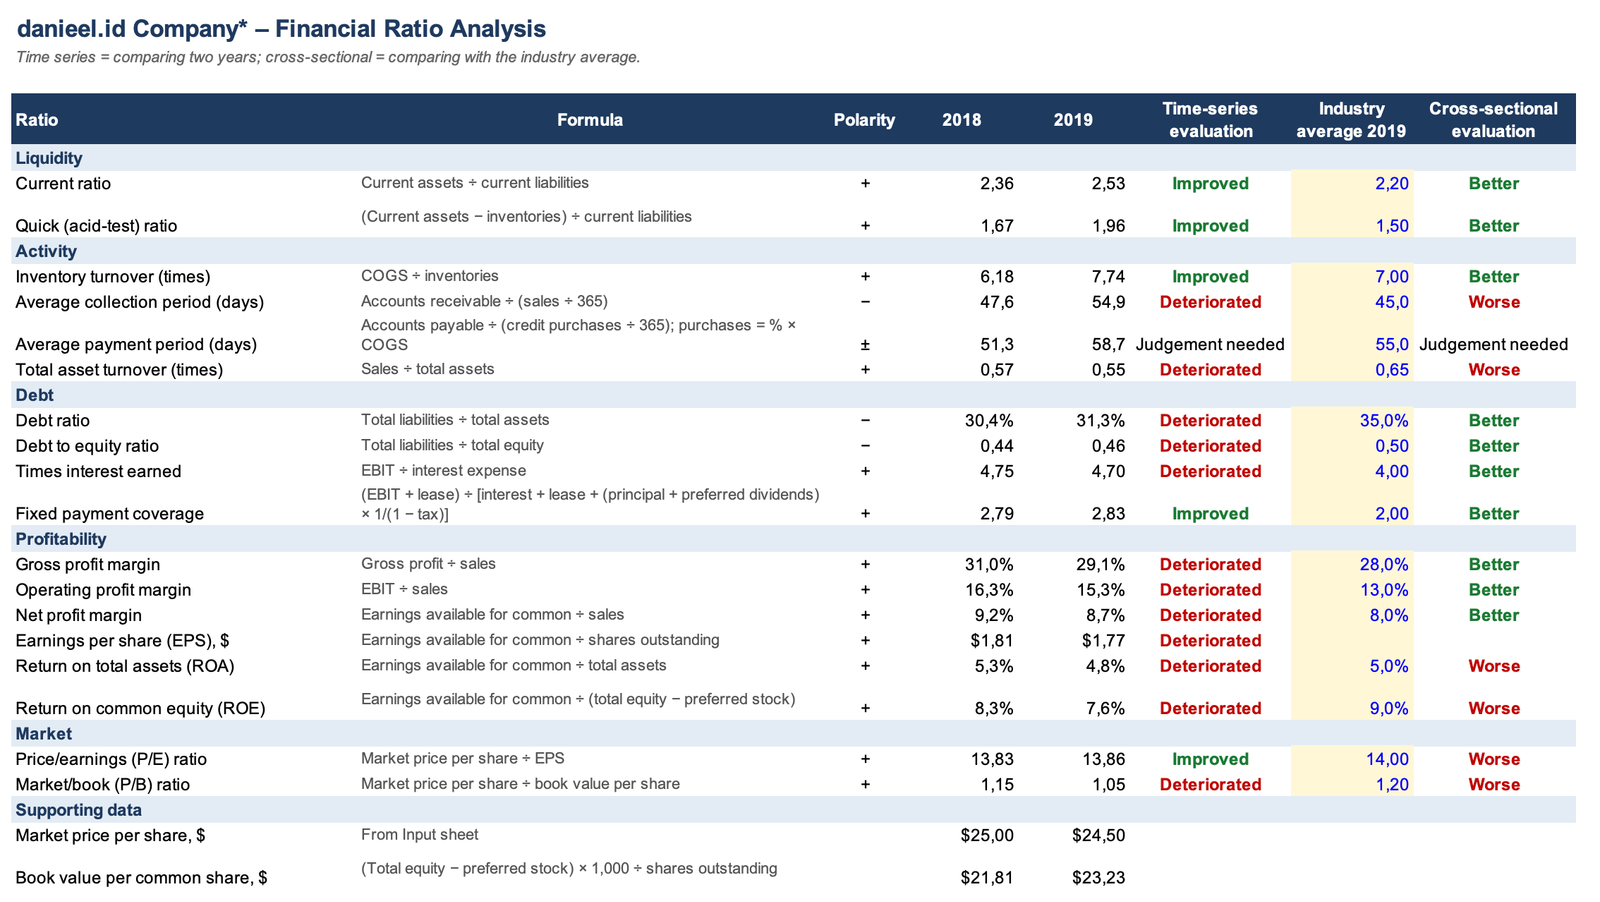
Liquidity, activity, debt, profitability, and market ratios are calculated automatically, each with its formula. Every ratio is evaluated two ways: against the prior year (improved or deteriorated) and against the industry average (better or worse). You can replace the industry averages with data for the industry you are analyzing.
3. DuPont analysis and free cash flow
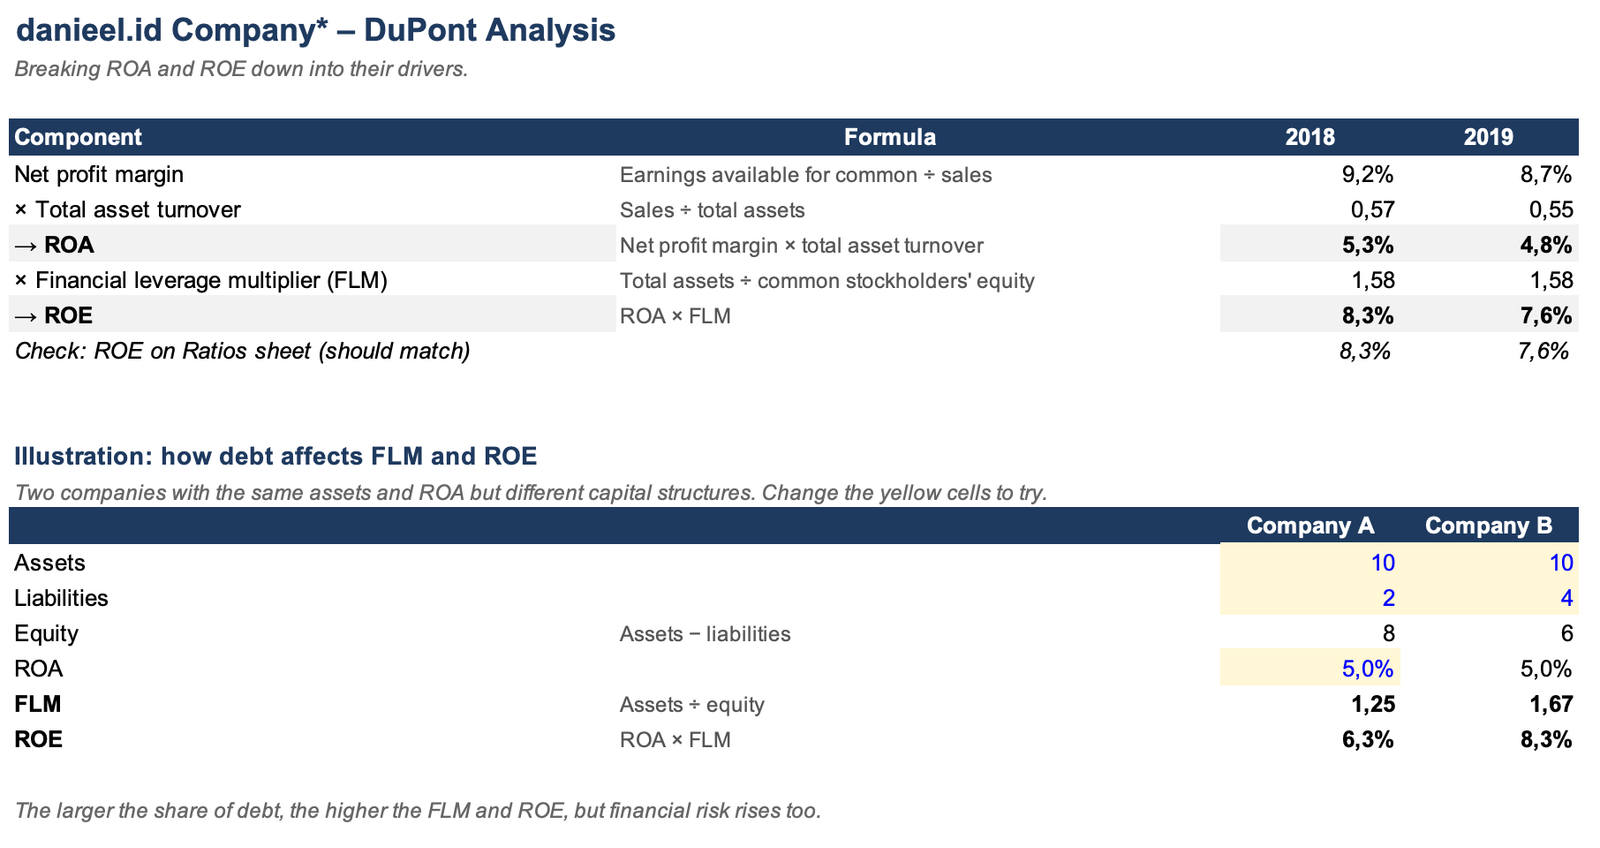
ROE is broken down into profit margin, asset turnover, and financial leverage, so you can see where shareholder returns actually come from. Free cash flow is calculated with three methods to show how much cash is truly free after operating and investment needs are met.
4. Cost of capital (WACC) and stock valuation
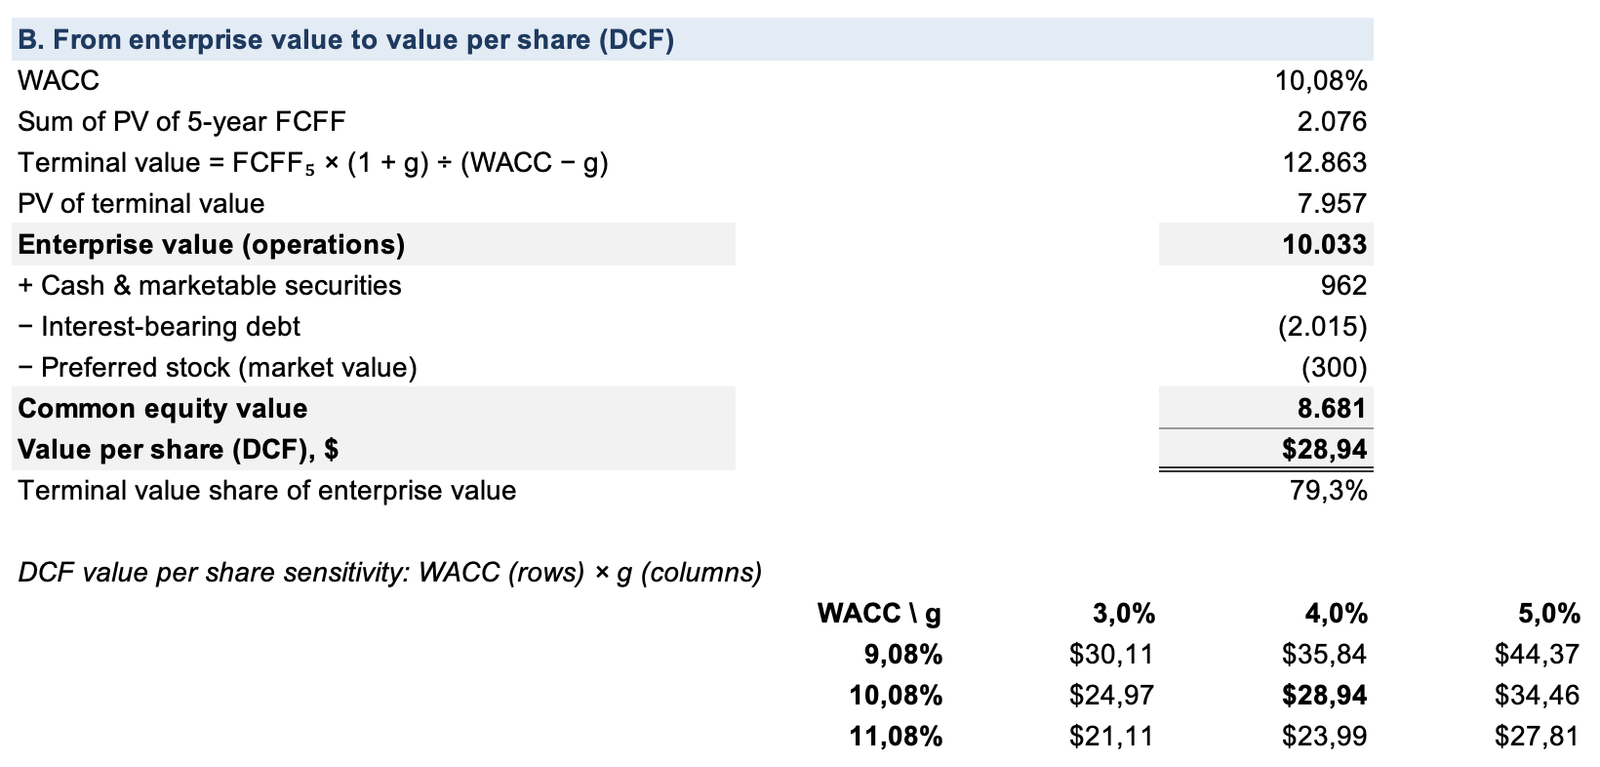
Cost of equity (CAPM), cost of debt (yield to maturity), cost of preferred stock, and WACC are calculated step by step. The result feeds a DCF/FCFF valuation with a sensitivity table, which is then compared with the dividend discount model (DDM), market multiples, and the current share price.
How to Use It
- Study the Example version. Open the file filled with danieel.id Company data to follow the calculation from the financial statements all the way to fair value.
- Fill in the Blank version. Copy the numbers from your chosen company’s financial statements into the yellow cells on the Input sheet, then add market assumptions such as beta and the growth rate.
- Check, then read the results. Make sure the balance sheet shows “✓ Balanced” and the cash flow “✓ Reconciled”. The ratios, DuPont analysis, free cash flow, WACC, and fair value are then ready, and your job is to interpret them.
Learn with Articles, Videos, and the E-book
This template is the hands-on companion to the financial statements series on danieel.id. Each part of the template pairs with material that explains the concept, so you can learn the idea first and then try it straight away in Excel.
| Template section | Articles on danieel.id | E-book |
|---|---|---|
| Four financial statements | Types of Financial Statements, Income Statement, EBITDA vs Net Profit, Balance Sheet, Changes in Equity, Cash Flow Statement | Chapters 1–6 |
| 18 financial ratios | Company Financial Ratios | Chapter 7 |
| DuPont analysis | DuPont Analysis | Chapter 8 |
| Free cash flow | Financial Statement Analysis Guide | Chapter 9 |
| Cost of capital (WACC) | Cost of Equity, Cost of Debt, WACC | Chapters 10–12 |
| Stock valuation | Stock Valuation | Chapter 13 |
Video versions are being released gradually on the @danieelid YouTube channel. Want to learn in order from the beginning? Start with the learning roadmap.
Who Is It For?
- Beginner investors who want to value stocks with numbers rather than just follow recommendations.
- Students learning financial statement analysis or valuation.
- Business owners and employees who want to understand a company’s financial performance.
This template is not a buy or sell signal tool. The results depend on the data and assumptions you enter, so they still need to be read with judgment.
Buying Options
| Product | What you get | Price |
|---|---|---|
| Excel Template | Example and Blank versions (.xlsx). Buy now | US$3.99 |
| E-book + Template Bundle | Reading Financial Statements and Stock Valuation e-book plus the Excel template. Coming soon, when the e-book is released. | US$8.99 Launch price: US$7.49 |
Specifications and Access
- Two .xlsx files: an Example version and a Blank version.
- Best opened in Microsoft Excel 2016 or later. It usually also opens in Google Sheets, although the layout and some formatting may differ slightly.
- Download links appear on the order confirmation page once payment is confirmed, are sent to your email, and are available under My Account → Downloads if you create an account at checkout.
- Each file can be downloaded up to 5 times.
- Formula sheets are protected without a password so they are not deleted by accident; you can unlock them via Review › Unprotect Sheet if you want to modify them.
- Single-user license.
Frequently Asked Questions
Can I use this template for any listed company?
Yes. Fill the Blank version with the numbers from any company’s financial statements, whether it is listed in the US, Indonesia, or elsewhere.
Do I need the e-book to use the template?
No. The Example version already shows how the calculations flow, and the concepts behind each section are explained in free articles on danieel.id. The e-book helps you understand them more deeply and in sequence.
Can I use it for coursework or at work?
Yes, for learning, coursework, personal analysis, and your own work. If you publish the results, please credit danieel.id as the source. One purchase covers one user, and the files may not be resold, shared, or uploaded elsewhere without written permission.
Can I get a refund?
Because this is a digital product, downloaded purchases are non-refundable unless a file is corrupted, does not match its description, or the download link does not work. See our Refund Policy for details.
Disclaimer: this template is an analysis and education tool, not investment advice, and not a recommendation to buy or sell any security. danieel.id Company is a fictional company used for practice.
This post is also available in: