







Sales are up 12%. Net profit is up 4%. Good news, right? But take a look at one line near the very bottom of the income statement: earnings per share actually fell 2%. Shareholders who were celebrating a moment ago are suddenly scratching their heads (and fair enough, since what they own is the shares, not the sales).
How can that happen? The answer only shows up when we read company financial ratios, not just the nominal figures. Company financial ratios compare two items in the financial statements, such as current assets against current liabilities or profit against equity, to assess a company’s liquidity, efficiency, debt, profitability, and market valuation. A single number standing on its own tells us almost nothing; once it is compared with something, it starts to talk.
The easiest way to understand it: financial ratios are a lot like the results of a medical check-up. A blood sugar reading only means something once we compare it with the reference range and with last year’s result, and one number slightly outside the range does not necessarily mean we are sick. Company financial ratios work the same way: the industry average is the “reference range”, and the previous year is our “old lab result”.
So that we don’t stop at theory, we will use one example that runs from start to finish: the imaginary company danieel.id Company in 2018–2019. The figures are the same as in the example in the article on how to read a company’s income statement, so they are easy to trace.
How to Read Company Financial Ratios Without Jumping to Conclusions
Reading company financial ratios properly requires two benchmarks: the previous year (time series) and the average of similar businesses in the industry (cross-sectional). Without a benchmark, a figure like 2.53 or 7.6% cannot be called good or bad.
On top of that, use consistent definitions from year to year, compare only with similar businesses (a corner shop and a cement plant obviously have different “reference ranges”), and read every change together with the notes to the financial statements.
To make the map easier to follow, here are the five groups of company financial ratios and the question each one answers:
| Ratio group | Question it answers | Example ratios |
|---|---|---|
| Liquidity | Can it pay its short-term debts? | Current ratio, quick ratio |
| Activity | How efficiently do assets and working capital turn over? | Inventory turnover, collection period |
| Debt (solvency) | How much debt is there, and can it be serviced? | DER, times interest earned |
| Profitability | How much profit comes from sales and capital? | Net profit margin, ROA, ROE |
| Market | What do investors pay for earnings and book value? | P/E ratio, price-to-book ratio |
In other words, each group looks at the company from a different angle, so a fair conclusion only emerges when all five are read together.
Here are the Income Statement and Balance Sheet of danieel.id Company that we dissected in the article on 4 types of financial statements (figures in thousands of dollars):
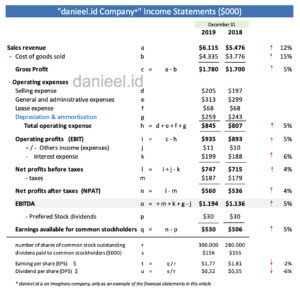
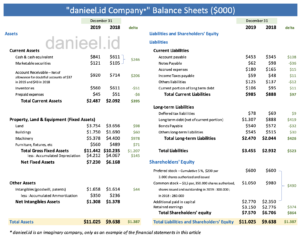
The formulas and industry averages follow the textbook Principles of Managerial Finance by Gitman and Zutter (13th edition). Let’s start with the group closest to the company’s “day-to-day wallet”.
Liquidity Ratios: Can the Company Pay Its Short-Term Debts?

Liquidity ratios are company financial ratios that measure the ability to pay obligations due within one year using current assets. The two most commonly used measures are the current ratio and the quick ratio.
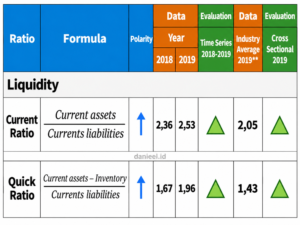
In 2019, danieel.id Company’s current ratio was $2,487 ÷ $985 = 2.53, up from 2.36 in 2018 and above the industry average of 2.05. Every $1 of current liabilities is backed by about $2.53 of current assets.
The quick ratio is “stricter” because it leaves out inventory, which cannot be turned into cash as quickly as cash or receivables. The 2019 result was ($2,487 − $560) ÷ $985 = 1.96, better than 1.67 in 2018 and the industry average of 1.43.
So liquidity is strong. However, higher is not automatically better. Cash piling up without being put to work is like money stashed under the mattress: safe, but it earns nothing.
It is worth noting that the quality of current assets matters as much as the amount. Bad receivables or slow-moving inventory can make the balance sheet look healthy even when the company’s ability to pay is weak. So when using company financial ratios for real-world analysis, check the receivables aging and inventory composition in the notes to the financial statements.
Activity Ratios: How Efficiently Do the Assets Work?

Activity ratios are the group of company financial ratios that measure how quickly inventory, receivables, trade payables, and total assets turn into sales or cash. This group assesses operating efficiency.
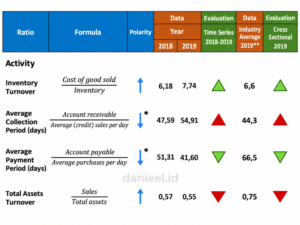
In 2019, inventory turnover was $4,335 ÷ $560 = 7.74 times, up from 6.18 times and above the industry average of 6.6 times. That means goods “stay over” in the warehouse for about 365 ÷ 7.74 ≈ 47 days on average. The ideal figure depends on the business; a vegetable stall obviously needs much faster turnover than a car dealership.
Because credit sales are not reported separately, we use total sales: $920 ÷ ($6,115 ÷ 365) = 54.91 days. This is worse than 47.59 days and longer than the industry average of 44.3 days. If customers get 60-day credit terms, this result is still reasonable; if the terms are 30 days, the collections team has some work to do.
Annual purchases are assumed to be 65% of COGS. The 2019 result is $453 ÷ (65% × $4,335 ÷ 365) = 58.68 days, longer than 51.31 days in 2018 but still shorter than the industry average of 66.5 days. The good news is that this period is slightly longer than the 54.91-day collection period, so cash from customers generally comes in before suppliers’ invoices fall due.
Total asset turnover dipped from 0.57 to 0.55, while the industry average is 0.75. Roughly speaking, every $1 of assets generates 55 cents of sales, while competitors average 75 cents. The cause could be factory capacity that is not fully used or investment in new machinery (up almost $1 million on the balance sheet) that has not started producing yet.
Debt Ratios: How Heavy Is the Borrowing Burden?

Among company financial ratios, debt or solvency ratios measure how much of the company is financed by creditors rather than owners, as well as how well operating profit can cover interest and fixed payments. Debt is not always bad; what matters is the dose.
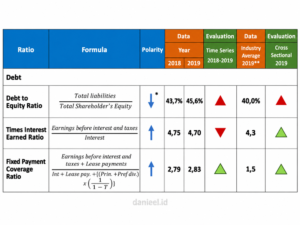
The debt-to-equity ratio (DER) rose from 43.7% to 45.6% ($3,455 ÷ $7,570), slightly above the industry average of 40.0%. This means creditors’ share of the financing grew relative to the owners’ capital. Risk did go up, but debt can also act as financial leverage (using borrowed money to grow assets and returns) if the investment it funds earns more than the interest cost. As the Mandiri Sekuritas guide to stock ratios points out, DER should be compared with companies in the same industry.
In Islam, debts are also meant to be recorded carefully: “O you who have believed, when you contract a debt for a specified term, write it down.” (QS. Al-Baqarah: 282, Sahih International translation). Of course, this verse is not a DER formula, but the spirit is the same: a clearly recorded debt is easier to measure and to be accountable for.
Times interest earned in 2019 was $935 ÷ $199 = 4.70 times, down slightly from 4.75 times but still above the industry average of 4.3 times. Put simply, operating profit can cover interest almost five times over.
Fixed payment coverage adds lease payments, principal repayments, and preferred stock dividends to the test. The 2019 result was 2.83 times, up from 2.79 times and well above the industry average of 1.5 times. So fixed charges are still comfortably covered, although the rising DER trend still needs watching.
Profitability Ratios: How Much Profit Is Left?

Profitability ratios are company financial ratios that measure how much of each sale is left as profit, and how much profit is generated from assets and the owners’ capital. This is where the puzzle at the start of the article begins to unravel.
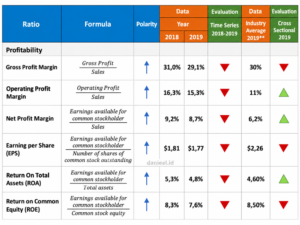
In 2019, gross profit margin fell from 31.0% to 29.1%, slightly below the industry’s 30.0%. Operating profit margin fell from 16.3% to 15.3%, and net profit margin from 9.2% to 8.7%; both remain above the industry averages (11.0% and 6.2%). The main cause is visible in the income statement: sales rose 12%, but cost of goods sold rose 15%.
To put it in everyday terms, out of every $100 of sales, the net profit left over fell from $9.20 to $8.70. The difference is small, but left unchecked for years it can erode the quality of growth. An important lesson from company financial ratios: nominal profit can go up while margins go down.
EPS for 2019 was $530 thousand ÷ 300,000 shares = $1.77, down from $1.81. Now, here is the answer to the opening puzzle: earnings available to common shareholders did rise 5%, but shares outstanding grew from 280,000 to 300,000 (up about 7%), so the profit “cake” was cut into more slices. EPS is not a dividend either; dividends per share were only $0.52, about 29.4% of earnings per share.
ROA fell from 5.3% to 4.8%, slightly above the industry’s 4.6%. ROE fell from 8.3% to 7.6% ($530 ÷ $6,970 of common equity), below the industry’s 8.5%. The causes can be traced by breaking ROA and ROE down into margin, asset turnover, and leverage using DuPont Analysis.
Market Ratios: What Price Are Investors Paying?

Market ratios are the part of company financial ratios that compare the share price with earnings per share and book value per share, showing how investors value the company’s performance and prospects. This group is relevant for companies whose shares are traded.
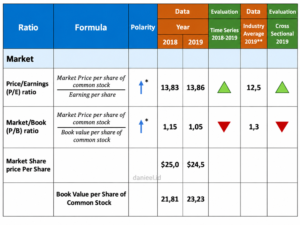
With a share price of $24.50 and EPS of $1.77, the 2019 P/E ratio was 13.86 times, almost the same as 13.83 times in 2018 and above the industry average of 12.5 times. Investors are willing to pay about $13.86 for every $1 of earnings per share. A high P/E can reflect growth expectations, or it can mean the price is relatively expensive (investors aren’t fortune tellers, after all, hehe), so check earnings growth and risk.
Book value per share in 2019 was $6,970 thousand ÷ 300,000 = $23.23. At a price of $24.50, the price-to-book ratio was 1.05 times, down from 1.15 times and below the industry average of 1.3 times. However, a low P/B does not automatically mean cheap, because book value does not necessarily reflect the economic value of assets, especially for businesses that rely on brands or technology.
For stocks listed on the Indonesia Stock Exchange (IDX), we don’t have to calculate everything from scratch. IDX displays P/E, PBV, DER, ROA, ROE, and net profit margin in its stock screener, along with an explanation of each column. It is handy for initial screening, but the analysis still needs to go back to the financial statements. To estimate a fair price, continue with the article on stock valuation methods.
Frequently Asked Questions About Financial Ratios
What are the types of company financial ratios?
Company financial ratios are generally divided into five types: liquidity, activity, debt (solvency), profitability, and market. Some textbooks call activity ratios efficiency ratios, but the content is much the same.
What current ratio is considered healthy?
There is no single number that applies to every business; the current ratio should be compared with the average of similar companies and with the company’s own trend. A retailer whose cash turns over quickly can be comfortable with a low current ratio, while a seasonal business needs a thicker cushion.
Does a low P/E ratio mean a stock is cheap?
Not necessarily; a low P/E can mean a stock is cheap, but it can also signal that the market expects earnings to fall or sees high risk. So compare the P/E with similar companies and check the quality of earnings before drawing conclusions.
So, What Do Company Financial Ratios Really Tell Us?
Back to the opening puzzle: sales went up and profit went up, but earnings per share went down. Once we take it apart, the story is complete. danieel.id Company’s liquidity is strong and inventory is turning over faster, but collections have slowed and its assets are not yet as efficient as competitors’. Debt has increased but is still manageable, margins are thinning because costs rose faster than sales, and new shares mean profit per share is spread thinner.
Just like the medical check-up results earlier, company financial ratios don’t hand down a verdict; they point to the parts that need a closer look. The first step is simple: take the financial statements of a listed company you know, calculate the current ratio, net profit margin, and ROE for the last two years, then compare them with its closest competitor.
Of the five groups above, which ratio do you look at most often when assessing a company, and has a single ratio ever led you to the wrong conclusion? Share your experience below; the discussion could become something we all learn from.
The numbers in financial statements can’t speak for themselves, but once we ask the right questions through company financial ratios, they often answer more honestly than any press release.
This post is also available in: