






When a company builds a factory or expands its business, the question is not just how much funding it needs. We also need to know what that funding costs. Understanding the WACC calculation helps us assess whether an investment’s return is appropriate for its risk and cost of capital.
Weighted Average Cost of Capital (WACC) is the weighted average return required by a company’s capital providers. Its sources may include debt, preferred stock, and common equity. “Cost” here does not always mean a cash payment: shareholders still expect a return even when the company pays no dividends.
Disclaimer: Companies X and Y and all example figures are fictional and provided for educational purposes. The choice of examples is not advice to buy, sell, or hold investment instruments, nor a positive or negative assessment of any particular company. The practice figures are not current market data. For actual decisions, check up-to-date information and consider the circumstances and risks involved.
The WACC Calculation: Formula and Fundamentals
Suppose Company Y has a debt weight of 40% and an equity weight of 60%. If its after-tax cost of debt is 7% and its cost of equity is 12%, its WACC is (40% × 7%) + (60% × 12%) = 10%. Specifying “after-tax” matters because we must not count the tax benefit twice.
WACC = wd × kd × (1 − T) + wp × kp + we × ke
V = D + P + E; wd = D ÷ V; wp = P ÷ V; we = E ÷ V
D, P, and E are the market values of interest-bearing debt, preferred stock, and common equity. Each k represents the cost of that source of capital; kd is before tax, while T is the relevant marginal tax rate. The weights must total 100%. If there is no preferred stock, P and its weight are zero.

For valuation, use market value weights or a well-supported target capital structure rather than simply copying balance sheet proportions. The market value of common equity is the share price multiplied by the number of shares outstanding. Debt includes relevant interest-bearing financing, including its current portion; do not include all operating liabilities. Retained earnings are already part of common equity and must not receive a separate additional weight.
The book value of debt can be an approximation when its market value is difficult to obtain, but explain why you use it. When performing a WACC calculation, use consistent dates, currencies, and annual rate conventions for all inputs. The discussion of company financial ratios helps us understand leverage and interest coverage before setting financing assumptions.
Cost of Debt
In a WACC calculation for valuation, the cost of debt reflects the interest rate currently required by the market. We can use the YTM of a representative bond, a benchmark rate plus a credit spread, or a synthetic rating estimate. The interest rate on a new loan can also provide a useful indication. Historical interest expense divided by the debt balance does not automatically represent today’s borrowing cost.
After-tax kd = kd × (1 − T)
The tax benefit applies when interest is deductible for tax purposes and the company can use the resulting savings. Throughout this exercise, T = 25% is a fictional assumption, not a statement of Indonesia’s applicable tax rate. Debt is often cheaper than equity, but additional borrowing can also increase default risk and the cost of capital.
Market YTM and the Effective Cost of Issuance
Company X has a bond with a face value of Rp100 million per unit of analysis, a 10-year term, a 9.5% coupon paid annually, and a market price equal to face value. With no special options and a schedule of full coupon periods, its market YTM is 9.5%. In the valuation example, the after-tax cost of debt is 9.5% × 75% = 7.125%.
Bond Price = Σt=1…n [Coupon ÷ (1 + y)t] + Face Value ÷ (1 + y)n
y is the YTM per period, and n is the number of remaining periods. YTM equates the price with the present value of promised payments; it does not guarantee the actual return.
If the issuer sells the bond at face value and pays issuance costs of 3%, its net proceeds are Rp97 million. The effective issuance cost is calculated by replacing the price in the equation with net proceeds. In Excel, =RATE(10,-9500000,97000000,-100000000) produces 9.987984% per year. Depending on your Excel settings, the argument separator may be a semicolon.
This differs from the 9.5% market YTM because it includes issuance costs. For an issuance analysis, the simple after-tax approximation is 9.987984% × 75% = 7.490988%; the tax treatment of issuance costs still needs to be examined. One-time issuance costs can also be included separately in the project’s initial cash flow. Do not include them in cash flows while also raising the discount rate to reflect the same costs, as this would count them twice.
If coupons are paid semiannually, adjust the number of periods and payments per period, then distinguish between nominal and effective annual rates. For a fuller discussion of the available methods, read how to calculate cost of debt.
Cost of Preferred Stock
Preferred stock generally has priority over common stock for dividends and liquidation proceeds, subject to the instrument’s terms. Its payments are called dividends, not interest. Voting rights and whether dividends are cumulative need to be checked; not all preferred stock has the same features.
For perpetual preferred stock with a fixed dividend, the cost based on market price is:
kp = Dp ÷ Pp
Dp is the annual dividend per share, and Pp is the market price. Company X pays a fixed dividend of Rp300, with a market price of Rp3,000. Its cost is 10%. There is no (1 − T) adjustment as there is for debt in this example.
For a new issue with issuance costs of Rp60 per share, net proceeds are Rp2,940. The cost based on net proceeds is Rp300 ÷ Rp2,940 = 10.204082%. This measures the issuance scenario, rather than the dividend yield based on market price. Redeemable or convertible instruments require an appropriate cash flow model.
Cost of Common Equity
The cost of equity is the return shareholders require for taking on investment risk. Two common approaches are the dividend growth model and CAPM. I use both so we can understand where the numbers come from, rather than treating the result of a single formula as a certainty.
The Gordon Growth Model and Dividend CAGR
P0 = D1 ÷ (ke − g)
ke = D1 ÷ P0 + g
P0 is the current share price, D1 is next year’s dividend, and g is the sustainable dividend growth rate. The model requires ke > g and is suitable for reasonably stable dividend patterns.
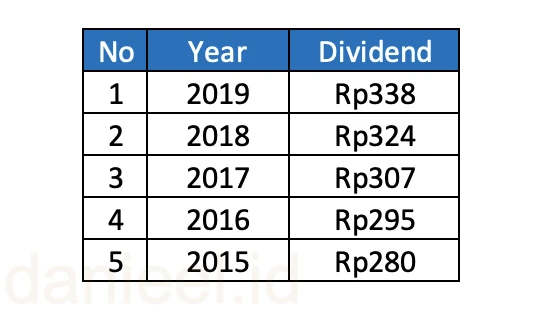
CAGR = (Ending Dividend ÷ Beginning Dividend)1/n − 1
Five annual observations from 2015 to 2019 contain four intervals. Therefore, CAGR = (338 ÷ 280)1/4 − 1 = 4.818917%. Historical CAGR is only an indication; future growth needs to be assessed alongside earnings, the payout ratio, and the ability to reinvest.
Using that assumption for g, a price of Rp4,125, and an estimated D1 of Rp355, the cost of equity is 355 ÷ 4,125 + 4.818917% = 13.424977%. D1 is rounded as a practice estimate; it does not have to equal Rp338 × (1 + g) exactly.
Capital Asset Pricing Model
ke = Rf + β × ERP
ERP = E(Rm) − Rf
As a fictional alternative, an Rf of 6%, a beta of 1.2, and an equity risk premium of 6% produce a cost of equity of 13.2%. Beta measures sensitivity to market risk, rather than all company risk. ERP is an estimate of the expected premium; historical index returns do not guarantee future returns.
Use a benchmark in the same currency as the cash flows. Local government bond yields are a practical reference, but they are not automatically free of default risk; avoid counting the country risk premium twice. The discussion of cost of equity with CAPM explains the components in more detail. CAPM and Gordon results do not have to match, and there is no need to average them without a reason.
Cost of Retained Earnings
Retained earnings are not free capital. Shareholders give up the opportunity to receive those funds and invest them elsewhere at a comparable level of risk. The cost of retained earnings therefore uses the relevant cost of common equity.
kr = ke
In the Company X exercise, the cost is 13.424977%. In a WACC calculation, retained earnings are part of equity, so do not add the weights of common stock and retained earnings as if they were two separate market values. The decision to retain earnings also needs to be supported by investment opportunities that create value.
Cost of a New Common Stock Issue
For a new common stock issue, we can calculate the cost based on net proceeds by adjusting the dividend model:
Ne = P0 − u − f; knew = D1 ÷ Ne + g
u is the difference between the market price and the issue price, while f is the issuance cost per share. If the market price is Rp4,125, the issue price is Rp4,000, and issuance costs are Rp100, net proceeds are Rp3,900. The cost based on net proceeds is 355 ÷ 3,900 + 4.818917% = 13.921481%.
Under the same assumptions, this figure is higher because net proceeds are lower. However, do not conclude that new shares are always the most expensive source of financing for every company. When valuing an ongoing business, one-time issuance costs need to be treated consistently and should not automatically be included as a permanent increase in the cost of equity.
A WACC Calculation Example for Company X
We choose the cost of equity from the Gordon model and fictional market value weights: debt 50%, preferred stock 10%, and common equity 40%. For this WACC calculation, use market-based costs without issuance costs to keep the basis consistent.
| Source | Weight | Cost | Contribution |
|---|---|---|---|
| After-tax debt | 50% | 7.125000% | 3.562500% |
| Preferred stock | 10% | 10.000000% | 1.000000% |
| Common equity | 40% | 13.424977% | 5.369991% |
| Total | 100% | WACC | 9.932491% |
WACC = (50% × 7.125%) + (10% × 10%) + (40% × 13.424977%) ≈ 9.93%
Keep full precision throughout the WACC calculation and round the final result. Using the CAPM estimate of 13.2% gives 9.8425%. This difference shows how cost of equity assumptions affect the result; choose the method based on the company’s characteristics and the quality of the inputs.
Using WACC for Investment and Valuation
WACC can be the discount rate for cash flows available to all capital providers, or free cash flow to the firm (FCFF). Cash flows available to shareholders, or FCFE, use the cost of equity. Mixing the two can produce misleading valuations.
Project NPV = −Initial Investment + Σt=1…n [FCFFt ÷ (1 + WACC)t]
For projects with comparable risk, consistent currencies and cash flow conventions, and conventional cash flow patterns, an IRR above the cost of capital supports accepting the project. However, NPV is more reliable when there are multiple IRRs or projects are mutually exclusive. Higher-risk projects need a discount rate appropriate to their risk.
In company valuation, the present value of FCFF gives the value of operations. Adjust for non-operating assets and debt and preferred stock claims before dividing by the number of common shares outstanding. Only then can the resulting per-share value be compared with the share price. Test sensitivity to WACC and terminal growth, particularly when the two are close.
Checking Actual Data
For real-world applications, obtain audited financial statements and debt notes through the Indonesia Stock Exchange’s financial statements and annual reports or the issuer’s official website. Check bond prices and yields at PHEI, and review applicable ratings at PEFINDO. Read the prospectus for coupon schedules, options, and preferred stock rights.
Record the data collection date, sources, currency, number of shares, basis for the tax rate, and reasons for choosing the beta and risk premium. Do not mix consolidated and parent-only financial statements without careful consideration. WACC can change with financing conditions and business risk.
Conclusion
The WACC calculation connects the costs of debt, preferred stock, and equity with their financing weights. The key is not simply adding percentages, but ensuring that the inputs and cash flows use a consistent basis. Start with a simple example, check the assumptions, and consider several scenarios before drawing an investment conclusion.
Sources
- Lawrence J. Gitman & Chad J. Zutter, Principles of Managerial Finance, 13th edition.
- Aswath Damodaran, Estimating Inputs for Valuation: cost of capital, CAPM, and the dividend growth model.
- Aswath Damodaran, Valuation: matching cash flows with discount rates.
This post is also available in: