








When looking at a company’s ROA and ROE, we might immediately ask: are the numbers good or not? I prefer to follow up with another question: where do those results come from? DuPont Analysis helps us answer this by connecting earnings, sales, assets, and shareholder equity.
This is the third article in a series discussing company financial statements. The previous two articles covered four types of company financial statements and financial ratios for assessing company performance. We continue to use the imaginary company “danieel.id/ Company” as an example to make the relationships between numbers easier to follow.
With DuPont Analysis, profitability ratios can be traced back to their constituent components. A high ROE can result from good margins, efficient asset utilization, or a large equity multiplier. Each carries different implications for the company.
Understanding DuPont Analysis before calculating ratios
ROA or Return on Assets measures the return on assets. ROE or Return on Equity measures the return on shareholder equity. In this example, both definitions follow the previous ratio article: the numerator used is earnings available for common stockholders, which is the profit available to common shareholders after preferred stock dividends.
ROA = Earnings Available for Common Stockholders ÷ Total Assets × 100%
ROE = Earnings Available for Common Stockholders ÷ Common Equity × 100%
Common equity includes common stock, additional paid-in capital, and retained earnings. Thus, the denominator for ROE is not just the par value of common stock. In companies with preferred stock, common equity also differs from total shareholder equity.
Financial statements of the imaginary company danieel.id/
Below are the original income statement and balance sheet that form the basis of the calculations. All nominal values in the statements use units of thousands of dollars ($000).
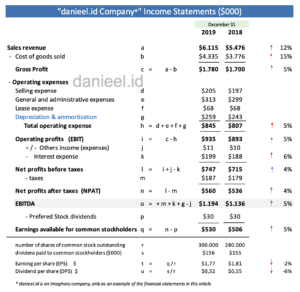
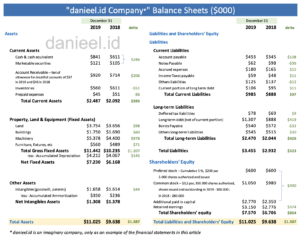
The 2019 figures we need are sales of $6,115, earnings available for common stockholders of $530, total assets of $11,025, total liabilities of $3,455, and total equity of $7,570. Preferred stock of $600 is excluded from total equity, so common equity is $7,570 − $600 = $6,970.
DuPont Formula: the relationship between margin and asset turnover
DuPont Analysis breaks down ROA into two components: net profit margin and total asset turnover. Margin indicates the portion of sales available as earnings for common stockholders. Asset turnover shows how much sales are generated by the company’s assets.
Net Profit Margin = Earnings Available for Common Stockholders ÷ Sales × 100%
Total Asset Turnover = Sales ÷ Total Assets
ROA = Net Profit Margin × Total Asset Turnover
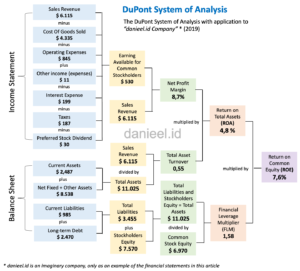
The calculation follows the diagram: net profit margin = $530 ÷ $6,115 × 100% ≈ 8.7%. Total asset turnover = $6,115 ÷ $11,025 ≈ 0.55 times. Thus, ROA = 8.7% × 0.55 ≈ 4.8%. Using the direct formula, $530 ÷ $11,025 × 100% also yields approximately 4.8%.
This relationship can be written in full as follows:
ROA = (Earnings Available for Common Stockholders ÷ Sales) × (Sales ÷ Total Assets) × 100%
= Earnings Available for Common Stockholders ÷ Total Assets × 100%
Sales in the numerator and denominator cancel each other out. However, this separation is beneficial because it shows the source of ROA changes. We can assess whether the company is losing margin or has not generated enough sales from its assets.
Improving net profit margin
Margins can be improved through pricing, product mix, and cost control. In the diagram, sales are reduced by COGS of $4,335 and operating expenses of $845, plus other income of $11, then reduced by interest of $199, taxes of $187, and preferred dividends of $30. The resulting figure is earnings available for common stockholders of $530.
Raising prices certainly needs to consider purchasing power and competition. Cost reduction also needs to be chosen carefully. Cutting machine maintenance or customer service could improve short-term profits but disrupt future production and sales. We need to find costs that do not provide proportional benefits.
Increasing total asset turnover
Asset turnover can be increased by boosting sales from available assets, optimizing plant capacity, reducing unproductive assets, or adding investments capable of generating adequate sales. Marketing programs need to be evaluated after accounting for discounts and additional costs.
Companies with thin margins often rely on rapid turnover. Conversely, businesses with large assets may require higher margins. This pattern is not an absolute rule. Compare with similar business models and investigate their operating conditions before judging a number as good or bad.
Modified DuPont Formula: from ROA to ROE
The next stage connects ROA with ROE through the Financial Leverage Multiplier (FLM), also called the equity multiplier. In this example’s DuPont Analysis, the multiplier is calculated using common equity to align with the ROE denominator.
FLM = Total Assets ÷ Common Equity
ROE = ROA × FLM
ROE = Net Profit Margin × Total Asset Turnover × FLM
The company’s FLM is $11,025 ÷ $6,970 ≈ 1.58 times. Thus, ROE = 4.8% × 1.58 ≈ 7.6%. The direct formula is $530 ÷ $6,970 × 100% ≈ 7.6%.
ROE = (Earnings Available for Common Stockholders ÷ Sales) × (Sales ÷ Total Assets) × (Total Assets ÷ Common Equity) × 100%
= Earnings Available for Common Stockholders ÷ Common Equity × 100%
Total assets follow the equation total liabilities + total equity. In the diagram, $3,455 + $7,570 = $11,025. To calculate FLM, the denominator remains $6,970 because total equity includes $600 of preferred stock. Thus, FLM here is influenced by liabilities and preferred funding relative to common equity; both need to be differentiated.
Simple example of the impact of liabilities
To make it easier, let’s reuse two companies without preferred stock. Company A has assets of $10, equity of $8, and liabilities of $2. Its FLM is 10 ÷ 8 = 1.25 times. Company B has the same assets, $10, but equity of $6 and liabilities of $4. Its FLM is 10 ÷ 6 ≈ 1.67 times.
For the same assets, a larger proportion of liabilities results in a higher equity multiplier. FLM is a ratio without currency units, so the result is written as “times,” not dollars. If both companies have the same ROA, Company B will mathematically have a higher ROE.
However, increasing debt also increases interest and payment obligations. ROA does not automatically remain constant when the funding structure changes. Debt-financed investments may fail to generate sufficient profit, causing ROE to decline. A high multiplier needs to be read in conjunction with risk and repayment capacity.
To assess funding capacity, examine DER, interest coverage, fixed payment coverage, and cash flow. Industry averages provide context, but being below average does not guarantee a company can take on more debt. Maturity schedules, revenue stability, and investment needs also determine this.
Conclusion
DuPont Analysis shows that ROE is shaped by profit margin, asset turnover, and the equity multiplier. For the imaginary company danieel.id in 2019, a margin of 8.7% and asset turnover of 0.55 times resulted in an ROA of 4.8%. After being multiplied by an FLM of 1.58 times, the ROE became 7.6%.
The benefit of DuPont Analysis is that it helps us identify areas that need deeper examination. If margins decline, investigate pricing and costs. If turnover is slow, check asset productivity. If the multiplier increases, look at the funding structure and its payment burden. Connect the analysis results with the financial statements as a whole before making decisions.
That’s all; I hope it’s helpful. If you have any questions, feedback, or suggestions, please leave them in the comments section.
Source
Lawrence J. Gitman & Chad J. Zutter, Principles of Managerial Finance, 13th Edition.
Additional reference: OpenStax, Profitability Ratios and the DuPont Method, for the relationship between margin, asset turnover, equity multiplier, and the use of average balances.
This post is also available in: