






A practical guide to understanding assets, liabilities, equity, and changes in a company’s financial position through simple examples.
How to read a balance sheet is actually not as difficult as often imagined. For people who don’t work in accounting every day, the rows of accounts and numbers on financial statements can indeed feel like a foreign language. However, once we understand the relationship between assets, liabilities, and equity, the balance sheet starts to look like a story: what the company owns, where its financing comes from, and what has changed compared to the previous year.
A balance sheet, or balance sheet and often also called a statement of financial position, shows a company’s condition on a specific date. This is different from an income statement, which describes performance over a period. Simply put, a balance sheet is like a photo of a company’s financial condition on the reporting date.
In IAS 1 on the presentation of financial statements, the statement of financial position is part of a complete set of financial statements. Assets and liabilities are generally separated into current and non-current groups, unless a presentation based on liquidity provides more relevant information. For general readers, this division helps us see short-term needs and long-term resources more clearly.
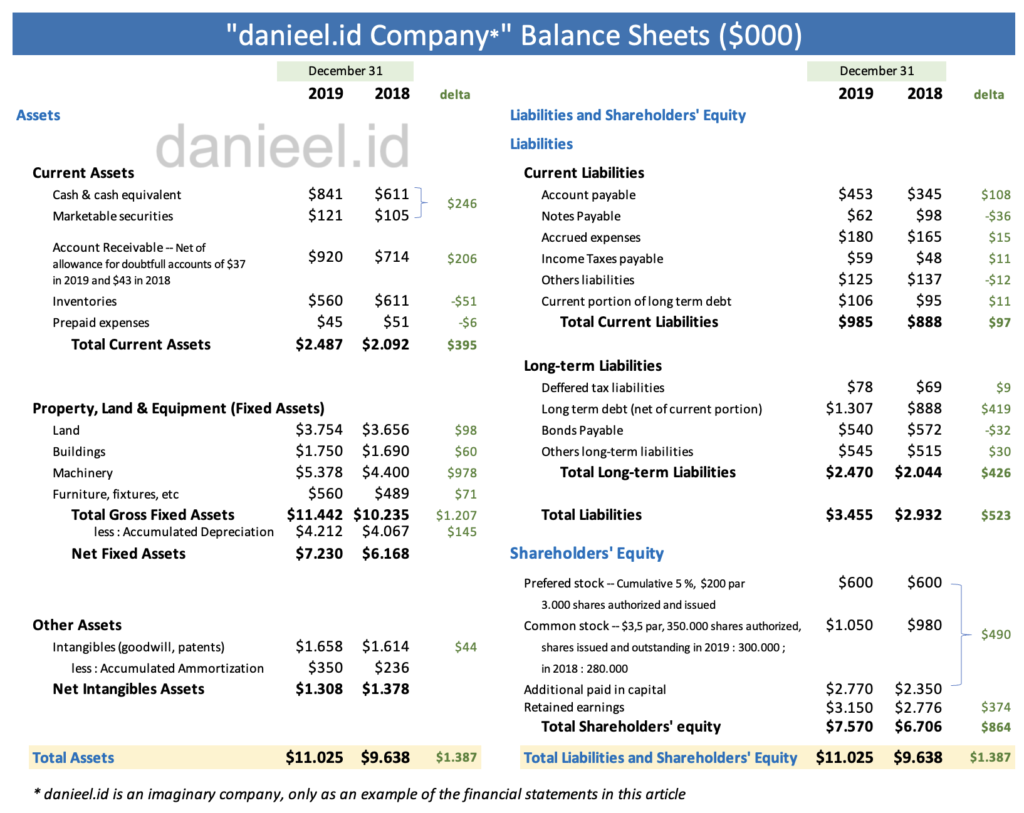
This article uses an imaginary company “danieel.id/ Company” engaged in manufacturing. All numbers in the examples are stated in thousands of US dollars ($000), exactly as the numbers appear in the screenshots. This example is for educational purposes, not an investment recommendation.
How to Read a Balance Sheet through the Basic Equation
The first step in how to read a balance sheet is understanding its basic equation:
Assets = Liabilities + Shareholders’ Equity
This equation explains that every company asset is financed by two sources. First, funds from other parties that become the company’s obligations. Second, funds that are the right of the owners or shareholders. Therefore, total assets must equal total liabilities plus equity.
In the 2019 example, total assets were $11,025. This figure equals total liabilities of $3,455 plus total equity of $7,570. For 2018, total assets of $9,638 also equaled liabilities of $2,932 plus equity of $6,706. This balance doesn’t necessarily mean the company is healthy. It only shows that the recording meets the basic accounting relationship.
Understanding Assets
Assets are economic resources owned or controlled by a company that are expected to provide future economic benefits. In the IFRS Conceptual Framework, assets, liabilities, and equity are the basic elements used to explain a company’s financial position.
Current assets
Current assets are cash and other assets expected to be realized, sold, or used within a normal operating cycle. In this example, the order starts from cash and cash equivalents, marketable securities, accounts receivable, inventory, and then prepaid expenses.
In the practice of how to read a balance sheet, this arrangement based on liquidity helps us move from assets that are easiest to turn into cash toward assets that require a longer time to be utilized.
Total current assets rose from $2,092 in 2018 to $2,487 in 2019, an increase of $395. Cash and marketable securities together rose by $246. This increase in liquidity looks positive, but we still need to find its source through the cash flow statement.
Accounts receivable also increased by $206, from $714 to $920. An increase in receivables can follow credit sales growth, but the money hasn’t been received by the company yet. Therefore, readers need to compare it with revenue growth and collection policies. Meanwhile, inventory fell by $51 and prepaid expenses fell by $6.
Non-current assets
Non-current assets are used to support company activities in the long term. In this manufacturing company, the largest group consists of land, buildings, machinery, as well as furniture and fixtures. The gross value of fixed assets is reduced by accumulated depreciation to obtain the net fixed asset value.
Total gross fixed assets rose by $1,207, from $10,235 to $11,442. The largest addition came from machinery, which rose by $978. After deducting accumulated depreciation, net fixed assets increased from $6,168 to $7,230, up $1,062. This figure gives a clue that the company is making a significant investment in its operating capacity. However, the benefits of that investment can only be assessed by seeing if production, sales, and profits also increase in the following period.
The company also had net intangible assets of $1,308 in 2019, down $70 from $1,378. This decrease occurred because accumulated amortization increased more than the increase in the gross value of intangible assets.
Understanding Liabilities
Liabilities are a company’s economic obligations to creditors, suppliers, workers, the government, and other parties. In how to read a balance sheet, the duration of the obligation is important because it determines how quickly the company must provide cash to settle it.
Current liabilities
Short-term liabilities generally must be settled within one year or within a normal operating cycle. In the example, this group consists of accounts payable, notes payable, accrued expenses, income tax payable, other liabilities, and the current portion of long-term debt.
Total current liabilities rose by $97, from $888 to $985. An increase in accounts payable of $108 was the largest contributor. At the same time, notes payable fell by $36. This change needs to be read alongside information regarding purchases, supplier payment terms, and operating cash flow.
Long-term liabilities
Total long-term liabilities rose from $2,044 to $2,470, an increase of $426. The largest increase came from long-term debt after the current portion, which was $419. Bonds actually fell by $32, while other long-term liabilities rose by $30 and deferred tax liabilities rose by $9.
Overall, total liabilities increased by $523 to $3,455. This figure shows that part of the asset growth was financed by additional obligations, especially long-term loans. That isn’t automatically bad. Debt can help a company finance investment, but the ability to pay interest and principal must still be checked through profits and cash flow.
Understanding Shareholders’ Equity
Shareholders’ equity is the owners’ residual claim on company assets after all liabilities are deducted. In this example, equity consists of preferred stock, common stock, additional paid-in capital, and retained earnings.
Preferred stock remained at $600. Common stock rose from $980 to $1,050, while additional paid-in capital rose from $2,350 to $2,770. Both changes together added $490 in capital. Retained earnings also rose by $374, from $2,776 to $3,150. Thus, total equity increased by $864, from $6,706 to $7,570.
Retained earnings is not the same as the amount of cash in the company’s account. This figure is the accumulation of profits that were not distributed as dividends and have been used in various assets or business needs. The relationship of its changes can be further understood through the statement of changes in equity.
Reading Balance Sheet Changes as a Single Story
The most important part of how to read a balance sheet is not memorizing the definition of each account, but connecting their changes. The company’s total assets increased by $1,387. From the funding side, total liabilities increased by $523 and equity increased by $864. In other words, asset growth was financed by a combination of additional obligations and additional owner capital.
The story seen from this example is quite clear. The company added $978 in machinery and $1,207 in total gross fixed assets. At the same time, long-term debt increased by $419. This indicates that part of the investment was financed with long-term loans. Equity also strengthened through stock issuance and an increase in retained earnings.
From a short-term perspective, current assets of $2,487 are larger than current liabilities of $985. The difference, or simple net working capital, is about $1,502. The 2019 current ratio is about 2.53 times, up from about 2.36 times in 2018. On the surface, the company has current assets more than twice its current obligations. However, the quality of current assets is also important. Cash is easier to use than receivables or inventory.
The debt to equity ratio (DER) can be calculated by dividing total liabilities by total equity. The 2019 DER was about 0.46, slightly higher than about 0.44 in 2018. This means that for every $1 of equity, the company has about $0.46 in liabilities. A value below 1 indicates that equity is greater than liabilities, but the benchmark for “good” or “bad” still depends on the industry, business model, cash flow stability, and cost of debt.
As such, how to read a balance sheet does not stop at one ratio. Changes in asset composition, obligation maturities, and sources of equity growth need to be read together.
A balance sheet gives the final position, not all the causes of change. To understand whether the machinery investment generated sales and profit, we need to look at the income statement. To know where cash came from and where it was used, we need to read the cash flow statement.
The four main reports complement each other as explained in the article understanding the four types of company financial statements.
Conclusion
How to read a balance sheet can start with three simple questions: what does the company own, what are its obligations, and what part belongs to the owners. After that, compare figures between periods and look for the relationship behind the changes.
In the danieel.id/ Company example, asset growth is primarily seen in machinery investment. The financing came from a combination of increased long-term debt, additional share capital, and retained earnings. The short-term liquidity position still looks adequate, while the debt-to-equity ratio increased slightly. This conclusion is not a final investment assessment, but an example of how a balance sheet can be read as a sensible business story.
Frequently Asked Questions
What is the difference between a balance sheet and an income statement?
A balance sheet shows the financial position on a specific date, while an income statement shows revenue, expenses, and profit or loss over a period.
Why must a balance sheet balance?
Because every asset has a source of financing. Those sources come from liabilities or equity, so total assets must equal total liabilities plus equity.
Is retained earnings the same as cash?
No. Retained earnings is the accumulation of profits not distributed as dividends. Those funds may have already been used to finance receivables, inventory, machinery, or other assets.
More details regarding the 4 Types of Company Financial Statements, namely: Income Statements (Income Statements), Balance Sheets (Balance Sheets), Statement of Changes in Equity (Statement of Changes in Equity) and Cash Flow Statements (Cash Flow Statements) can be read in the article: Understanding the 4 Types of Company Financial Statements.
Source:
Lawrence J Gitman & Chad J.Zutter, “Principles of Managerial Finance” 13th Edition
This post is also available in: