








Understanding the flow from sales to net income through an example of the imaginary company danieel.id for 2018–2019.
For people who don’t work in accounting, an income statement can sometimes feel like a foreign language. However, once the flow is understood, this report can answer very practical questions: is sales growing, are costs still under control, and is that growth actually generating profit?
In this article, I break down how to read an income statement in simple language. The examples come from the “Income” sheet of the imaginary company danieel.id. The figures are not real company data and are not intended as investment recommendations.
Generally, an income statement summarizes revenues and expenses over a period. Unlike a balance sheet, which depicts a position on a single date, an income statement shows performance over a specific span of time. International standards also require comparative figures from the previous period to make performance changes easier to read. Starting January 1, 2027, IFRS 18 on the presentation of financial statements will be effective for annual reporting periods, with early application permitted.
Example of an income statement for the imaginary company danieel.id
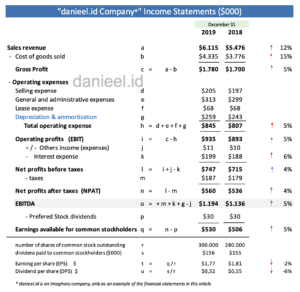
I intentionally created a detailed example with formulas for each component in the report so the calculation flow is visible. In practice, how to read an income statement starts by following the formulas in the middle section that connect each subtotal: sales minus cost of goods sold equals gross profit, then minus operating expenses to obtain operating profit, and so on until net income.
| Component ($000) | 2019 | 2018 | Change |
|---|---|---|---|
| Sales revenue | 6,115 | 5,476 | +12% |
| Cost of goods sold | (4,335) | (3,776) | +15% |
| Gross profit | 1,780 | 1,700 | +5% |
| Total operating expense | (845) | (807) | +5% |
| Operating profit (EBIT) | 935 | 893 | +5% |
| Net profit after tax | 560 | 536 | +4% |
| EBITDA | 1,205 | 1,146 | +5% |
| EPS ($ per share) | 1.77 | 1.81 | -2% |
| DPS ($ per share) | 0.52 | 0.55 | -6% |
Percentages are rounded. The figures in the table and screenshot are for educational purposes, not a public company report.
How to read an income statement from top to bottom
The basic principle is simple: don’t jump straight to net income. Follow each layer from top to bottom, then ask why a figure has changed compared to the previous period.
Revenue or sales revenue
Revenue is the value of sales of goods or services recognized during that period. In this example, revenue increased from $5.476 million to $6.115 million. The increase is about 12%.
That figure is just the beginning. We still need to find out if the growth came from sales volume, price increases, new products, or a combination of the three. A revenue increase supported only by price might have a different meaning than healthy volume growth.
Cost of goods sold and gross profit
Cost of goods sold (COGS) is the cost directly related to production, such as raw materials, direct labor, and factory overhead. Revenue minus cost of goods sold results in gross profit.
This is where the first signal appears. Revenue rose 12%, but cost of goods sold rose faster, at 15%. Gross profit ended up growing only 5%. Possible causes include rising raw material prices, direct labor costs, changes in the product mix, or the company’s limited ability to pass cost increases on to the selling price. This report alone is not enough to confirm the cause; we need to read the notes to the financial statements and management’s explanation.
Operating expenses and operating profit
After gross profit, we subtract operating expenses such as selling expenses, general and administrative expenses, rent, depreciation, and amortization. The result is operating profit or EBIT in this example.
The good news is that total operating expenses only rose by about 5%, well below revenue growth. The example company managed to contain the increase in operating costs. However, EBIT also only grew 5% because the main pressure had already occurred in the cost of goods sold.
Profit before tax and net income
EBIT is then adjusted for other income and interest expenses to obtain profit before tax. After tax expenses are deducted, the company recorded a net profit of $560 thousand, up about 4% from $536 thousand.
Interest, depreciation, and amortization can affect taxable income, but their deduction should not be considered automatic in all circumstances. Their treatment must follow tax regulations, useful lives, interest cost limits, and other applicable provisions.
Reading margins, not just nominal growth
One important habit in how to read an income statement is converting profit figures into margins. Margins compare each level of profit to revenue, so we can see the quality of growth more clearly.
- Gross profit margin = gross profit ÷ revenue. Decreased from about 31.0% in 2018 to 29.1% in 2019.
- Operating margin = EBIT ÷ revenue. Decreased from about 16.3% to 15.3%.
- Net profit margin = net profit ÷ revenue. Decreased from about 9.8% to 9.2%.
- EBITDA margin = EBITDA ÷ revenue. Decreased from about 20.9% to 19.7%.
All profit values did increase nominally, but every major margin declined. This means that every dollar of sales in 2019 generated less profit than in 2018. This is why reading growth percentages alone can be misleading.
Understanding EBITDA, EPS, and DPS
EBITDA
EBITDA is earnings before interest, taxes, depreciation, and amortization. In the example, the value can be calculated from EBIT plus depreciation and amortization: $935 thousand + $270 thousand = $1.205 million. EBITDA is useful for looking at operating performance before some financing decisions and non-cash costs, but it is not a substitute for net profit or cash flow. Readers who want to dive deeper into the differences can continue to the article The Difference Between EBITDA and Net Profit.
EPS and DPS
After the $30 thousand preferred stock dividend is deducted, $530 thousand is available for common shareholders. Divided by 300,000 shares, the 2019 earnings per share or EPS becomes $1.77.
There is an important lesson here: net profit rose, but EPS fell from $1.81 to $1.77. The cause is that the number of common shares outstanding increased from 280,000 to 300,000 shares, or about 7.1%, faster than the growth in profit available to common shareholders. That dilution spreads the profit over more shares.
Dividend per share or DPS also fell from $0.55 to $0.52. The company paid a slightly larger total common stock dividend, but the increased number of shares made the dividend per share lower.
Review of the danieel.id income statement
If I summarize this example, the imaginary company danieel.id is still growing and remains profitable. Revenue, gross profit, EBIT, net profit, and EBITDA all rose. Operating cost control also looks quite good.
However, the quality of growth needs to be scrutinized. Cost of goods sold grew faster than revenue, causing the gross margin to shrink by nearly 1.9 percentage points. This pressure flows down to the operating margin, EBITDA margin, and net profit margin. At the same time, the increase in the number of shares caused EPS and DPS to fall.
A reasonable conclusion is not “the company is definitely bad” or “the stock should be avoided.” This example instead shows the follow-up questions that need to be asked: is the COGS pressure only temporary, is the company expanding capacity, why did the shares increase, and does net profit generate healthy operating cash flow?
Important questions after reading the numbers
- Did the revenue increase come from volume, selling price, new products, or acquisitions?
- Why did the cost of goods sold grow faster than revenue?
- Did the margin decline occur once or has it become a trend over several years?
- Did operating costs grow slower than the business scale?
- Is net profit supported by operating cash flow or tied up in receivables?
- Did EPS change because of profit, new share issuance, share buybacks, or a combination of the three?
To answer these, the income statement needs to be read along with the balance sheet, cash flow statement, and notes to the financial statements. The OJK also defines an income statement as a summary of the income and expenses of a business entity over a certain period that depicts profit or loss.
Two main paths to increasing profit
Simply put, a company has two main paths: increasing revenue or controlling costs. Revenue is the result of sales volume multiplied by the selling price. Therefore, growth can come from selling more, raising prices, improving the product mix, or introducing new products.
On the cost side, efficiency does not always mean indiscriminate cutting. A company needs to determine which costs can be suppressed without damaging quality, capacity, safety, and long-term growth. To assess the impact of these decisions in full, also read my article on the four types of company financial statements.
Conclusion
The most useful way to read an income statement is to follow its flow from revenue to net profit, compare each figure with the previous period, and then test its margins. The danieel.id example shows that nominal profit can rise while margins and earnings per share actually fall.
An income statement provides the beginning of the story, not the whole story. Use the balance sheet, cash flow statement, statement of changes in equity, notes to the financial statements, and business context to understand the causes behind the numbers. With that habit, we don’t stop at the question “did profit go up or down,” but start assessing how that profit was formed.
More details on the 4 Types of Company Financial Statements, namely: Income Statements (Income Statements), Balance Sheets (Balance Sheets), Statement of Changes in Equity (Statement of Changes in Equity), and Cash Flow Statements (Cash Flow Statements), can be read in the article: Understanding the 4 Types of Company Financial Statements.
Source:
Lawrence J. Gitman & Chad J. Zutter, “Principles of Managerial Finance.” 13th Edition
This post is also available in: