






When a company borrows money, our question is not just how much it owes, but how much that borrowing costs. Understanding how to calculate cost of debt helps us make sense of financing decisions and lays the groundwork for calculating a company’s cost of capital.
In addition to owners’ equity, companies can raise funds through bank loans or corporate bonds. Interest compensates lenders for time and risk. However, the interest recorded in last year’s financial statements may differ from the rate the market would require today.
Disclaimer: Companies X and Y in the calculations below are fictional companies. These examples are for educational purposes only. They are not advice to buy, sell, or hold shares or bonds, nor are they a positive or negative assessment of any particular company. The practice figures do not represent current market conditions. For actual analysis, check audited financial statements, prospectuses, bond prices, and rating reports applicable on the date of your analysis.
Following Aswath Damodaran’s explanation, we can use the YTM of traded bonds, ratings and spreads, or an estimated synthetic rating. In his valuation materials, he writes: The cost of debt is the rate at which you can borrow at currently
. In other words, the emphasis is on the cost of borrowing today, rather than simply on historical interest costs.
Understanding corporate bonds before doing the calculations
A corporate bond is a debt security issued by a company. To understand the calculations, we need to know four terms:
- Face value or par value: the principal promised to be repaid at maturity. This differs from the market price and the minimum purchase amount.
- Coupon: the interest payment specified in the bond’s terms, usually expressed as an annual percentage of face value.
- Maturity: when the principal is due to be repaid; the frequency of coupon payments must be checked separately.
- Credit rating: a rating agency’s opinion on the credit risk of an issuer or a particular instrument.
Bonds may have fixed coupons, floating coupons, or no periodic coupon payments. Some also include options to convert into shares, allow the issuer to redeem them early, or allow holders to sell them back to the issuer. Here, we focus on a fixed-coupon straight bond without embedded options, making its cash flows easier to calculate.
To check an actual instrument, start with KSEI’s list of corporate bonds and the issuer’s prospectus. The bond series, currency, face value, coupon, and maturity must all match before you enter the figures into a formula.
Before-tax and after-tax cost of debt
Before-tax cost of debt is the borrowing cost rate before allowing for tax benefits. If interest is deductible for tax purposes and the resulting tax savings can actually be used, the after-tax cost is calculated as follows:
Here, kd is the before-tax cost of debt and T is the relevant marginal tax rate. I use T = 25% as a practice assumption to keep the original example consistent; this is not a statement of Indonesia’s current corporate tax rate.
Debt is often cheaper than equity, but it is not always the cheapest source of funding. Tax benefits may be limited, while additional debt can increase default risk and interest rates. Before you calculate cost of debt after tax, check whether the tax deduction can be used and which tax rules apply. The relationship between debt, earnings, and equity can be explored alongside the article on company financial ratios.
Calculate cost of debt using bond YTM
YTM is the discount rate that equates the present value of promised coupon and principal payments with the bond’s price. To estimate the current cost of debt, use the latest market price of a representative, sufficiently liquid bond. A 10% coupon does not automatically mean a 10% YTM: the market price may be below or above face value.

P is the bond price, C the coupon per period, F the principal, n the number of remaining periods, and y the YTM per period. This formula assumes a schedule of full periods; transactions between coupon dates require adjustments for accrued interest and day-count conventions. YTM is not a guarantee of the actual return either, because payments may be disrupted and coupons may be reinvested at a different rate.
An issuance example based on net proceeds
For a new bond issue, we can calculate an effective financing cost based on net proceeds. This differs from the market YTM of outstanding bonds because it includes issuance costs. Company X issues a total of Rp1 trillion in bonds at face value. We use a unit of analysis with a face value of Rp100 million, a five-year maturity, a 10% coupon paid annually, and issuance costs of 2% of face value.
| Component | Amount per unit of analysis |
|---|---|
| Principal, or F | Rp100,000,000 |
| Annual coupon, or C | Rp10,000,000 |
| Term, or n | 5 years |
| Issuance costs | Rp2,000,000 |
| Net proceeds, or N | Rp98,000,000 |
Total net proceeds are Rp980 billion. If the issue price is only 99% of face value and issuance costs remain at 2% of face value, net proceeds fall to Rp970 billion. Always specify the base used for the cost percentage so that face value is not confused with sale proceeds.
In the earlier cash-flow equation, replace P with N to obtain the effective cost of issuance. In Excel, the annual calculation can use =RATE(5,-10000000,98000000,-100000000). The positive sign represents funds received, while negative signs represent the company’s payments. Use semicolons if your Excel settings require them.
The result is approximately 10.5348% per year, or 10.53% after rounding. If the bond trades exactly at face value without including issuance costs, its market YTM is 10%. This difference explains why the two measures should not be mixed up when you calculate cost of debt.
An approximate formula for a quick check
Using amounts in millions of rupiah, the result is [10 + (100 − 98) ÷ 5] ÷ [(100 + 98) ÷ 2] = 10.5051%, rounded to 10.51%. The difference between principal and net proceeds must be divided by the term. To approximate market YTM, use P instead of N. This annual approximation does not replace an exact cash-flow calculation.
The after-tax cost in this example is 10.5348% × (1 − 25%) = 7.9011%, or 7.90%. If coupons are paid semiannually, adjust the number of periods and the coupon per period; distinguish the nominal annual rate from the effective annual rate.
Estimating the cost from credit ratings and spreads
When a bond price is not representative, a rating-based approach can help. A rating reflects credit risk, while the outlook indicates the possible direction of future changes. Neither guarantees repayment. Also check whether the rating applies to the issuer or to a particular bond series.
Choose a benchmark rate and spread that are consistent in currency, maturity, date, and rating scale. Government bond yields are often a practical benchmark, but they are not automatically free of default risk. If you use a local government benchmark, avoid adding the country risk premium twice.
To calculate cost of debt as a practice exercise, we retain the original example’s benchmark figures: 6.7855%, a spread of 158.01 basis points for X, and 618.70 basis points for Y. These figures come from a historical example from March 2021, are used for fictional companies, and are not current quotations or rating-to-spread mappings. One basis point equals 0.01 percentage points.
- Company X: 6.7855% + 1.5801% = 8.3656%; after tax at the assumed 25% rate, this becomes 6.2742%, or 6.27%.
- Company Y: 6.7855% + 6.1870% = 12.9725%; after tax at the assumed 25% rate, this becomes 9.7294%, or 9.73%.
Other things being equal, higher credit risk generally requires a larger spread. However, liquidity, collateral, seniority, and maturity also affect borrowing costs. Use PEFINDO’s rating reports to check actual ratings, then match them with price and yield data from official providers such as PHEI. Do not directly equate national-scale ratings with global-scale ratings.
Estimating the cost with a synthetic credit rating
If a company has no rating, the interest rate on a recently obtained long-term bank loan can provide a clue. Check additional fees, collateral, and whether the rate is fixed or floating. Another option is a synthetic rating: an estimate of credit risk based on financial characteristics.
In his explanation of synthetic ratings, Damodaran uses the interest coverage ratio to estimate a rating category and spread. The basic ratio is:
Suppose Company Y has EBIT of Rp60 billion and interest expense of Rp15 billion. Its interest coverage ratio is 4 times. Use earnings and interest from the same period and reporting scope; see the four types of company financial statements to understand how the figures relate to one another.
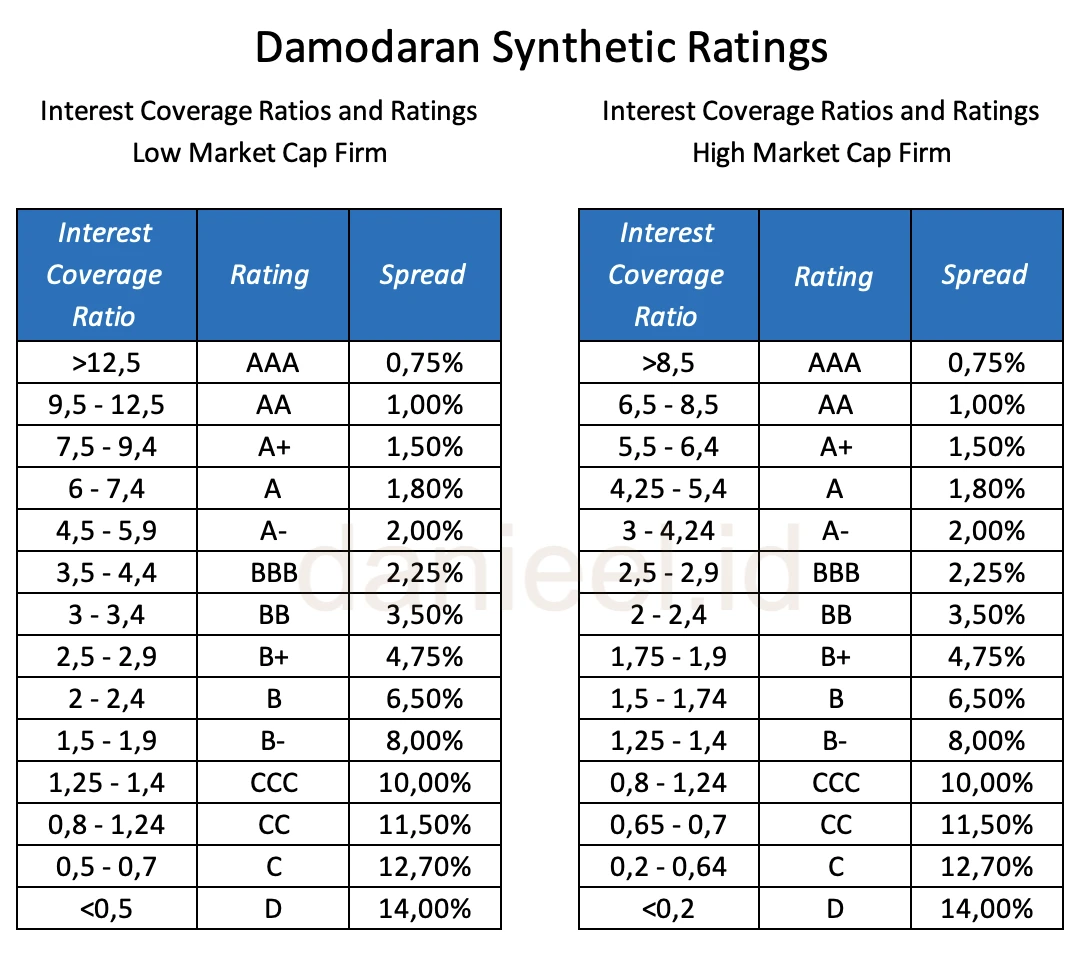
Those historical tables were developed using data from 1999–2000. Small and large companies use different ranges, so a single ratio does not automatically produce the same rating. For current applications, choose data that suit the company’s size, industry, country, and period. A synthetic rating remains an analyst’s estimate, not an official agency rating.
If the exercise assumes a 3% spread and a 6% benchmark rate, the estimated before-tax cost becomes 9%, followed by 6.75% after tax at the assumed 25% rate. The 3% spread is a fictional assumption, not the result of an actual rating for Company Y. Negative EBIT or very low interest expense also needs closer examination before this ratio is used.
Conclusion
To calculate cost of debt, choose a method that fits the available data: market YTM, ratings and spreads, or a synthetic estimate. Distinguish the current market cost from the effective cost of issuance, then consider tax benefits that can actually be used. In a valuation, keep the currency consistent with the cash flows and cost of equity.
The after-tax cost of debt is one component of WACC, the weighted average cost of capital. A calculation becomes useful only when its assumptions, date, and sources are clear. If you have any questions or feedback on these examples, feel free to share them in the comments.
Sources
- Lawrence J. Gitman & Chad J. Zutter, Principles of Managerial Finance, 13th edition; a reference from the original article.
- Aswath Damodaran, Damodaran Online; materials on the cost of debt and synthetic ratings are linked in the relevant sections.
- Investopedia — Yield to Maturity; an additional reference retained from the original article.
This post is also available in: