






The numbers in financial statements are actually just a starting point. Sales of $6.1 million or total assets of $11 million don’t tell much if read in isolation. These figures become more meaningful when compared to liabilities, profits, capital, previous periods, or other companies in the same industry. This is where company financial ratios help us see the relationships between numbers more clearly.
This article continues my discussion on how to read income statements, cash flow statements, and statements of changes in equity. The examples still use the imaginary company “danieel.id/ Company” for 2018–2019.
We will use five groups: liquidity, activity, debt, profitability, and market. Comparisons are made time series with the previous year and cross sectional with the industry average. One ratio is never enough to draw conclusions, let alone to make investment recommendations.
Therefore, reading company financial ratios is similar to checking a vehicle’s instrument panel. One indicator light can give a warning, but we only understand the condition after looking at other indicators and knowing the situation. High liquidity, for example, can reassure short-term creditors, but it doesn’t necessarily mean efficient asset utilization or adequate profits.
How to read company financial ratios comprehensively
Before diving into the formulas, there are three simple rules. First, use consistent definitions. If credit sales are not available, for example, we can use total sales to calculate the collection period, but its limitations must be stated. Second, compare companies with similar businesses because the business model affects the level of ratios considered reasonable. Third, read ratio changes along with the financial statements and their notes. The Indonesia Stock Exchange provides issuer reports in an increasingly standardized format through XBRL reporting, making data easier to compare without altering the reported substance.
We will continue to use the Financial Statement examples from the Imaginary Company danieel.id from my previous article: Understanding 4 Types of Company Financial Statements so that the relationships between the numbers are easier to follow.
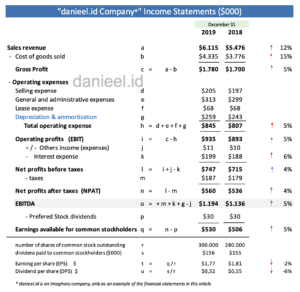
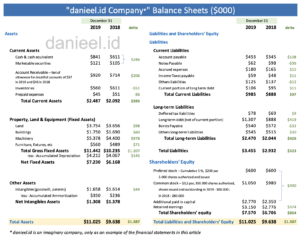
To make it easier, here I quote again the Income Statement (Income Statement) and Balance Sheet (Balance Sheet) from that example:
Liquidity Ratios

Liquidity ratios measure a company’s ability to meet short-term obligations. The two measures we use are the current ratio and the quick ratio.
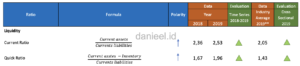
In 2019, danieel.id/ Company’s current ratio was $2,487 ÷ $985 = 2.53, up from 2.36 in 2018 and higher than the industry average of 2.05. This means that every $1 of current liabilities is supported by approximately $2.53 of current assets.
The quick ratio excludes inventory because inventory is generally not as quickly convertible to cash as cash or accounts receivable. The 2019 result was ($2,487 − $560) ÷ $985 = 1.96, also better than 1.67 in 2018 and the industry average of 1.43.
From these two figures, the company’s liquidity appears strong. However, a very high ratio is not automatically ideal. Excessively large and unproductive cash can depress asset returns. A reasonable figure also depends on business volatility, company size, and access to short-term financing.
Another thing to consider is the quality of current assets. Long-overdue receivables or hard-to-sell inventory can make the balance sheet figures look strong, but their solvency may not be as good as it appears. When using company financial ratios for real analysis, examine the age of receivables, loss provision policies, and inventory composition in the financial statement notes.
Activity Ratios

Activity ratios help us assess operational efficiency. The first measure is inventory turnover.
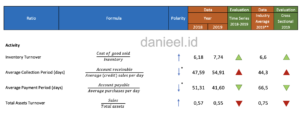
In 2019, the result was $4,335 ÷ $560 = 7.74 times, up from 6.18 times and exceeding the industry average of 6.60 times. The average inventory age can be estimated at 365 ÷ 7.74 = 47.2 days. The ideal value varies; a grocery store certainly needs faster turnover than a car manufacturer.
Using total sales as an approximation because credit sales are not separated, the 2019 collection period was $920 ÷ ($6,115 ÷ 365) = 54.91 days. This figure worsened from 47.59 days and is longer than the industry average of 44.3 days. If customer payment terms are 60 days, the result is still quite good. If standard terms are 30 days, the company needs to improve collections.
Since annual purchases are not directly listed, the example assumes purchases are 65% of COGS. The 2019 result is 41.60 days, down from 51.31 days and faster than the industry average of 66.5 days. Paying suppliers faster can maintain credit reputation, but a shorter payment period than the 54.91-day collection period can also strain cash flow.
Total asset turnover decreased slightly from 0.57 to 0.55, while the industry average is 0.75. This is a warning that assets are not being used as effectively as competitors to generate sales. The causes could be suboptimal plant capacity, unproductive assets, or new investments that have not yet started generating revenue.
Debt Ratios

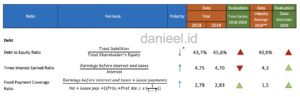
The debt to equity ratio (DER) increased from 43.7% to 45.6%, slightly above the industry average of 40.0%. This increase means that the use of creditor funds has grown compared to owner’s equity. Risk increases, but debt can also be financial leverage if the financed investments generate higher returns than the cost of debt.
The times interest earned or interest coverage ratio for 2019 was 4.70 times, a slight decrease from 4.75 times but still above the industry average of 4.3 times. This means earnings before interest and taxes are approximately 4.7 times the interest expense. The higher the figure, the greater the company’s capacity to pay interest.
The fixed payment coverage ratio expands the test by including leases, loan principal, and preferred stock dividends. The 2019 result was 2.83 times, up from 2.79 times and well above the industry average of 1.5 times. Overall, fixed charges are still covered quite safely, although the DER trend still needs to be monitored.
Profitability Ratios

Three margins show what portion of sales remains at different profit levels:
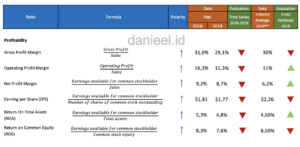
In 2019, the gross profit margin decreased from 31.0% to 29.1%, slightly below the industry average of 30.0%. The operating profit margin decreased from 16.3% to 15.3%, but is still above the industry average of 11.0%. The net profit margin decreased from 9.2% to 8.7%, also still higher than the industry average of 6.2%.
Thus, nominal profit can increase while margins decrease. In this example, COGS grew faster than sales. The company still generated relatively good margins but must control costs so that sales growth does not lose quality.
Margins should also not be compared across industries indiscriminately. Retail businesses can survive with thin margins due to high inventory turnover, while businesses with infrequent sales may require larger margins. In this context, company financial ratios work as a series: profit margins need to be read in conjunction with asset turnover, working capital needs, and funding structure.
EPS for 2019 was $1.77 per share. This figure is not the dividend automatically received by shareholders; the dividend per share in the example is $0.52, resulting in a payout ratio of approximately 29.4%. ROA decreased from 5.3% to 4.8%, slightly above the industry average of 4.6%. ROE decreased from 8.3% to 7.6%, below the industry average of 8.5%.
ROA and ROE are worth further examination with DuPont Analysis. This method breaks down returns into margin, asset turnover, and leverage, making the causes of change clearer.
Market Ratios

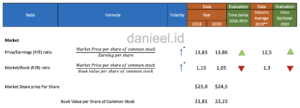
With a stock price of $24.50 and EPS of $1.77, the 2019 P/E ratio was 13.86 times, almost the same as 13.83 times in 2018 and higher than the industry average of 12.5 times. Investors pay approximately $13.86 for every $1 of earnings per share. A high P/E can reflect growth expectations, but it can also mean the price is relatively expensive. We need to examine earnings growth, risk, and business quality.
The book value per share for 2019 was $23.23. With a price of $24.50, the P/B ratio became 1.05 times, down from 1.15 times and below the industry average of 1.3 times. The market pays approximately $1.05 for every $1 of book value. However, a low P/B does not automatically mean it’s cheap. Book value does not necessarily reflect the economic value of assets, especially in businesses with many intangible assets.
The IDX also displays DER, net profit margin, P/E, P/BV, ROA, and ROE in the stock screener column explanation. This facilitates initial checks, but analysis must still refer back to the company’s financial statements and the definitions used.
Conclusion
From the danieel.id/ Company example, liquidity is quite strong, and inventory turnover has improved. On the other hand, the collection period has slowed, and asset turnover is below the industry average. DER has increased, but the ability to cover interest and fixed payments is still good. Margins, ROA, and ROE have decreased, while market valuation is near book value.
That is the main benefit of company financial ratios: not to provide a single quick answer, but to indicate which questions we should delve into. Compare ratios consistently, understand the causes of their changes, and then connect them with strategy, cash flow, industry conditions, and financial statement notes. In this way, numbers do not remain mere tables but become a story about the company’s health and direction.
Sources :
Lawrence J Gitman & Chad J.Zutter, “Principles of Managerial Finance” 13th Edition
This post is also available in:














Komentar Terbaru