


3. Cost of Common Stock Equity
The cost of common stock equity is the rate of return that shareholders expect as compensation for taking risk on their investment into the stock.
There are two common methods used in calculating the cost of common stock equity, namely Constant-Growth Valuation (Gordon Growth Model) and Capital Asset Pricing Model (CAPM).
Constant Growth Valuation (Gordon Growth Model)
This model departs from the premise that the valuation of a stock is the present value of all its future dividends.
One variant of this model formulates stock valuation assuming constant growth dividend (dividend value grows every year at a fixed percentage).
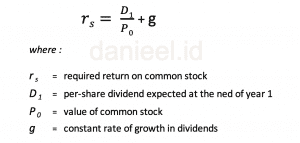
The formula of Constant Growth Valuation is as follows:

From the valuation formula, the cost of common stock equity (rs) can be determined as follows:
To be able to calculate growth (g) from the historical data of company dividends, we can use the CAGR (Compound Annual Growth Rate) formula as follows:

To be clear, let’s try with an example, still with the same imaginer company: The “danieel.id Bersaudara” Company.
In early 2020, the “danieel.id Bersaudara” company wants to determine the value of its common equity costs.
The company’s common stock (P0) market price is currently Rp 4,125 per share. The Company is expected to pay a dividend (D1) of Rp 355 per share in the following year (for the fiscal year 2020).
The historical data of the company’s dividend payments over the past 5 years (2015-2019) is as follows:

From the data, we can calculate the cost of common equity:
First, we determine the growth of the company’s dividend (g) with the CAGR formula.
= {(Rp 338/Rp 280)^(1/4)}-1 = 4.82 %
Then enter the number in the formula cost of common stock equity (rs) as previously explained.
= (Rp 355/ Rp 4,125)+ 4.82 % = 13.42 %
Capital Asset Pricing Model (CAPM)
The Capital Assets Pricing Model (CAPM) is a model used to calculate the cost of equity.
This model connects the required return on an investment with the level of risk to the investment. The level of risk on an investment (including stocks) is represented by a coefficient (beta).
For more details, here is the formula from CAPM:

- Risk free rate of return – usually measured by the yield of fixed rate government bonds with a tenor of 10 years, this is because government bonds are a type of investment that can be said to be (almost) completely risk-free.
- Beta coefficient is a relative measure of the level of risk on a particular asset (which is not diversified) to the average risk level of other assets, in this stock case can be interpreted as the level of volatility or sensitivity of a stock to market movements, in Indonesia market movements represented by IHSG / ICI (Indonesia Composite Index)
- Market Retun is the rate of return of the Market, in the case of Indonesia, is the return of the Indonesia Composite Index (ICI) also known as “Indeks Harga Saham Gabungan” (IHSG).
More details related to CAPM can be read in my article below:
How to Calculate Cost of Equity with CAPM Method
In the article I explained in detail each CAPM component, ranging from Risk Free (Rf), Beta Coefficient (b) and Market Return (rm). Risk premium and its depiction in the Security Market Line. How to obtain these numbers for the current condition of the Indonesian market, and the meaning of each number. Of course accompanied by examples of detailed calculations to make it easier to understand.
Okay, now we go into the example of calculating the cost of equity with CAPM Method
If the data is known as follows :
-
-
- From historical data on the stock price movements of “danieel.id Bersaudara” companies compared to the movement of the Stock Index, it is known that the company’s beta coefficient is 1.07.
- The government bond rate with a tenor of 10 years as a reference risk free (Rf) is currently 6.774%.
- The market return (rm) calculated from the geometric average return of IHSG/ICI over the past 20 years is 12.98%.
-
Then the required return or cost of equity “danieel.id Bersaudara” is:
We entered the data into the CAPM formula = 6.774% + [1.07 x (12.98 % – 6,774 %)] = 13.41 %
The cost of equity figures derived from this CAPM method (13.41%) are almost the same as The Gordon Growth Model (13.42%)
Cost of Retained Earnings
Dividends are paid periodically, usually at the expiration of the financial year, to shareholders (in this case common stockholders)
If at any time, the company requires financing for an investment from equity, say a sum of Rp X, the choice is two:
-
- first, the company can issue additional common stock to be sold to the market with the total value of the required amount of costs (Rp X), or
- the second option withholds or reduces the payment of dividends to shareholders with the same total value (Rp X).
In an accounting point of view, both options (whether selling additional shares/common stock or holding dividend payments) equally raise common stock equity.
For shareholders, the hold of the profit (not distributed or reduced dividends) is only acceptable if they obtain a yield that is at least equal to the required return of the retained earnings invested.
Viewed from this point of view, the cost of retained earnings is the same as the cost of common stock equity as we discussed earlier (can be calculated by two approaches, Gordon Growth Model or by CAPM method)
Cost of New Issue of Common Stock
If the Company issues new shares, there are costs related to flotation costs (underwriting costs and administrative costs), as well as under-pricing costs (usually new shares incurred sold below the current market price).
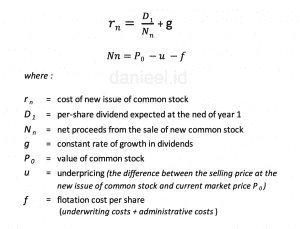
We can use The Gordon Growth Model to calculate The Cost of New Issue of Common Stock, with a slight adjustment.
If the cost of common stock equity in Gordon Growth Model: rs = (D1/P0) + g, then for The Cost of New Issue of Common Stock, we replace P0 with Net Proceeds (Nn) of the sale of the new stock (Common stock market price after deducting flotation cost and under-pricing cost)
The equation becomes as follows:
For more details, here is an example of the calculation of the cost of new issue of common stock
In the example of Gordon Growth Model as we discussed earlier, known data as follows:
-
-
- cost of common stock equity Company “danieel.id Bersaudara” 13.42%.
- Common stock market price (P0) Is Rp 4,125 per share.
- expected dividend (D1) of Rp 355 per share, and
- expected growth dividend (g) 4.82 %
-
“danieel.id Bersaudara” evaluates their likelihood of issuing new shares.
In current market conditions, it is estimated that new shares can be sold at a price of Rp 4,000 per share (slightly below the market price). Flotation cost is estimated at Rp 100 per share.
The cost of the new issue of common stock is:
First we calculate first Net Proceeds per share of the new shares = Rp 4,125 (market share price) – Rp 125 (under-priced) – Rp 100 (flotation cost) = Rp 3,900.
Then we enter the formula above, = (Rp 355/ Rp 3900) + 4.82 % = 13.92 %
As we can see, because net proceeds in the sale of new shares are smaller than the current market price, the cost of new issue of common stock will always be greater than the cost of existing common stock , or the cost of retained earnings.
The cost of new issue of common stock will always be greater than all long-term financing of the Company.
Summary
After we describe one by one the components of weighted average cost of capital (WACC), now let’s calculate WACC imaginer company “danieel.id Bersaudara“
From our previous calculations in the example case above, here is a summary of the cost of capital of the Company “danieel.id Bersaudara”
- cost of debt, ri = 7.49 %
- cost of preferred stock, rp = 10.2%
- cost of retained earnings, rr = 13.42 %
- cost of new common stock, rn = 13,92 %
After evaluating the availability of funds on the Company’s retained earnings, the “danieel.id Bersaudara” decided to use the cost of retained earnings as the cost of common stock equity (they did not issue new shares).
If known, the capital structure of this company is as follows:
- Long-term debt of 50%
- Preferred stock 10 %
- Common stock equity: 40%
We enter the data in the WACC formula
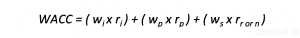
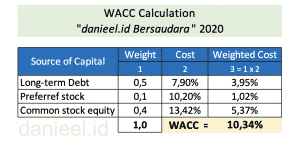
WACC “danieel.id Bersaudara” = (0.35 x 7.49%) + (0.1 x 10.2 %) + (0.55 x 13.42%) = 10.34 %
Or to be clear, we can see in the following table:
Closing
As stated at the beginning of this article, Weighted Average Cost of Capital (WACC) is very important in making investment decisions in the Company.
Every investment project in a company must provide a greater return (IRR) than the company’s WACC.
In addition, in assessing a company’s stock valuation, WACC is used as a discount rate of future cash flows to obtain net present value (NPV), which can be compared to the company’s stock market price.
More details about the valuation of the company’s shares can be read in the following article:
Let’s Learn Stock Valuation With Various Methods
If you have any questions or suggestions, feel free to write them down in the comments section at the bottom of this article.
Source :
- Lawrence J Gitman & Chad J.Zutter, “Principles of Managerial Finance” 13th Edition
- Damodaran Online
- Investopedia.com
This post is also available in:
![]() Indonesian
Indonesian